Scrutinizing the Relationship Between Chicago Retail Sales and Family Income
Scrutinizing the Relationship Between Chicago Retail Sales and Family Income
December 2022 (75.8)
We have been trying to answer the question of why Chicago’s per capita retail sales (and consequently its per capita retail sales tax collections) are below the statewide average, given the city’s significant tourism, entertainment, and business activities. In the August issue of Tax Facts we looked at per capita retail sales in Chicago, Suburban Cook County, and Illinois statewide, by category of retailer. Chicago trailed significantly in automobile and gasoline sales, explaining much of the difference, but it also fell behind suburban and statewide averages in nearly all retailer categories.
In September we turned to differences within Chicago, using the Illinois Department of Revenue’s sales tax collections by ZIP Code. Much of what we found was consistent with our expectations, like high collections from retailers in the Loop, where tourism and business visitors drive sales and where restaurant and bar sales are highest, and low collections from retailers near city borders. Interestingly, some of the neighborhoods with the highest total retail sales still fell below statewide per capita averages.
In this article we look at the relationship between income and retail sales to see if Chicago’s relatively larger low-income population reduces retail sales. Not surprisingly, we find a correlation.
What Sales, When, and Where?
For our comparisons, we look at the 1 percent municipal sales tax (part of the state’s 6.25 percent sales tax) imposed on all taxable sales—even groceries—made by businesses which have registered as grocery stores. As in the last article, we have added neighborhoods (community areas from the Northeastern Illinois Planning Commission) to help readers visualize where the ZIP code is located. We use 2019 data because that was the latest year available from the Census Bureau when we first noticed Chicago’s low per capita collections. It has the added advantage of being before COVID-19 turned retail on its ear.
Instead of using all collections, for this income/sales comparison we look at collections only from grocery stores (category 2 on the Department of Revenues SIC code report), the least discretionary of the categories and the one least skewed by tourist and business visitors.
Note: Groceries purchased with food stamps (technically SNAP – the Supplemental Nutrition Assistance Program) are not subject to sales tax, but we believe even with this caveat they are the best focus, and that the non-taxability of SNAP purchases does not inappropriately skew the results. First, SNAP purchases account for only 10 percent of grocery store sales. Second, although Chicago has more low income residents and a higher use of SNAP (19.8 percent of households), the Statewide average is a not insignificant 13.1 percent.
It’s worth noting, again, that this data tells us where the retailer is located, not the buyer. The sale to a Chicagoan living in Logan Square who treks to Eataly on Ohio Street to buy a loaf of Italian bread will be credited to 60611 (Navy Pier and the Magnificent Mile). Similarly, if that same person drives to Wisconsin (or Waukegan) to buy cheese curds, that sale will not appear in the data. Further, the grocery store sales data (1) includes more than groceries – it includes the toilet paper, toothpaste and t-shirts sold at grocery stores, and (2) does not include all grocery sales – it excludes groceries sold by a retailer registered as a department store. Nevertheless, this data is useful in evaluating why Chicago’s per capita sales lag the state average.
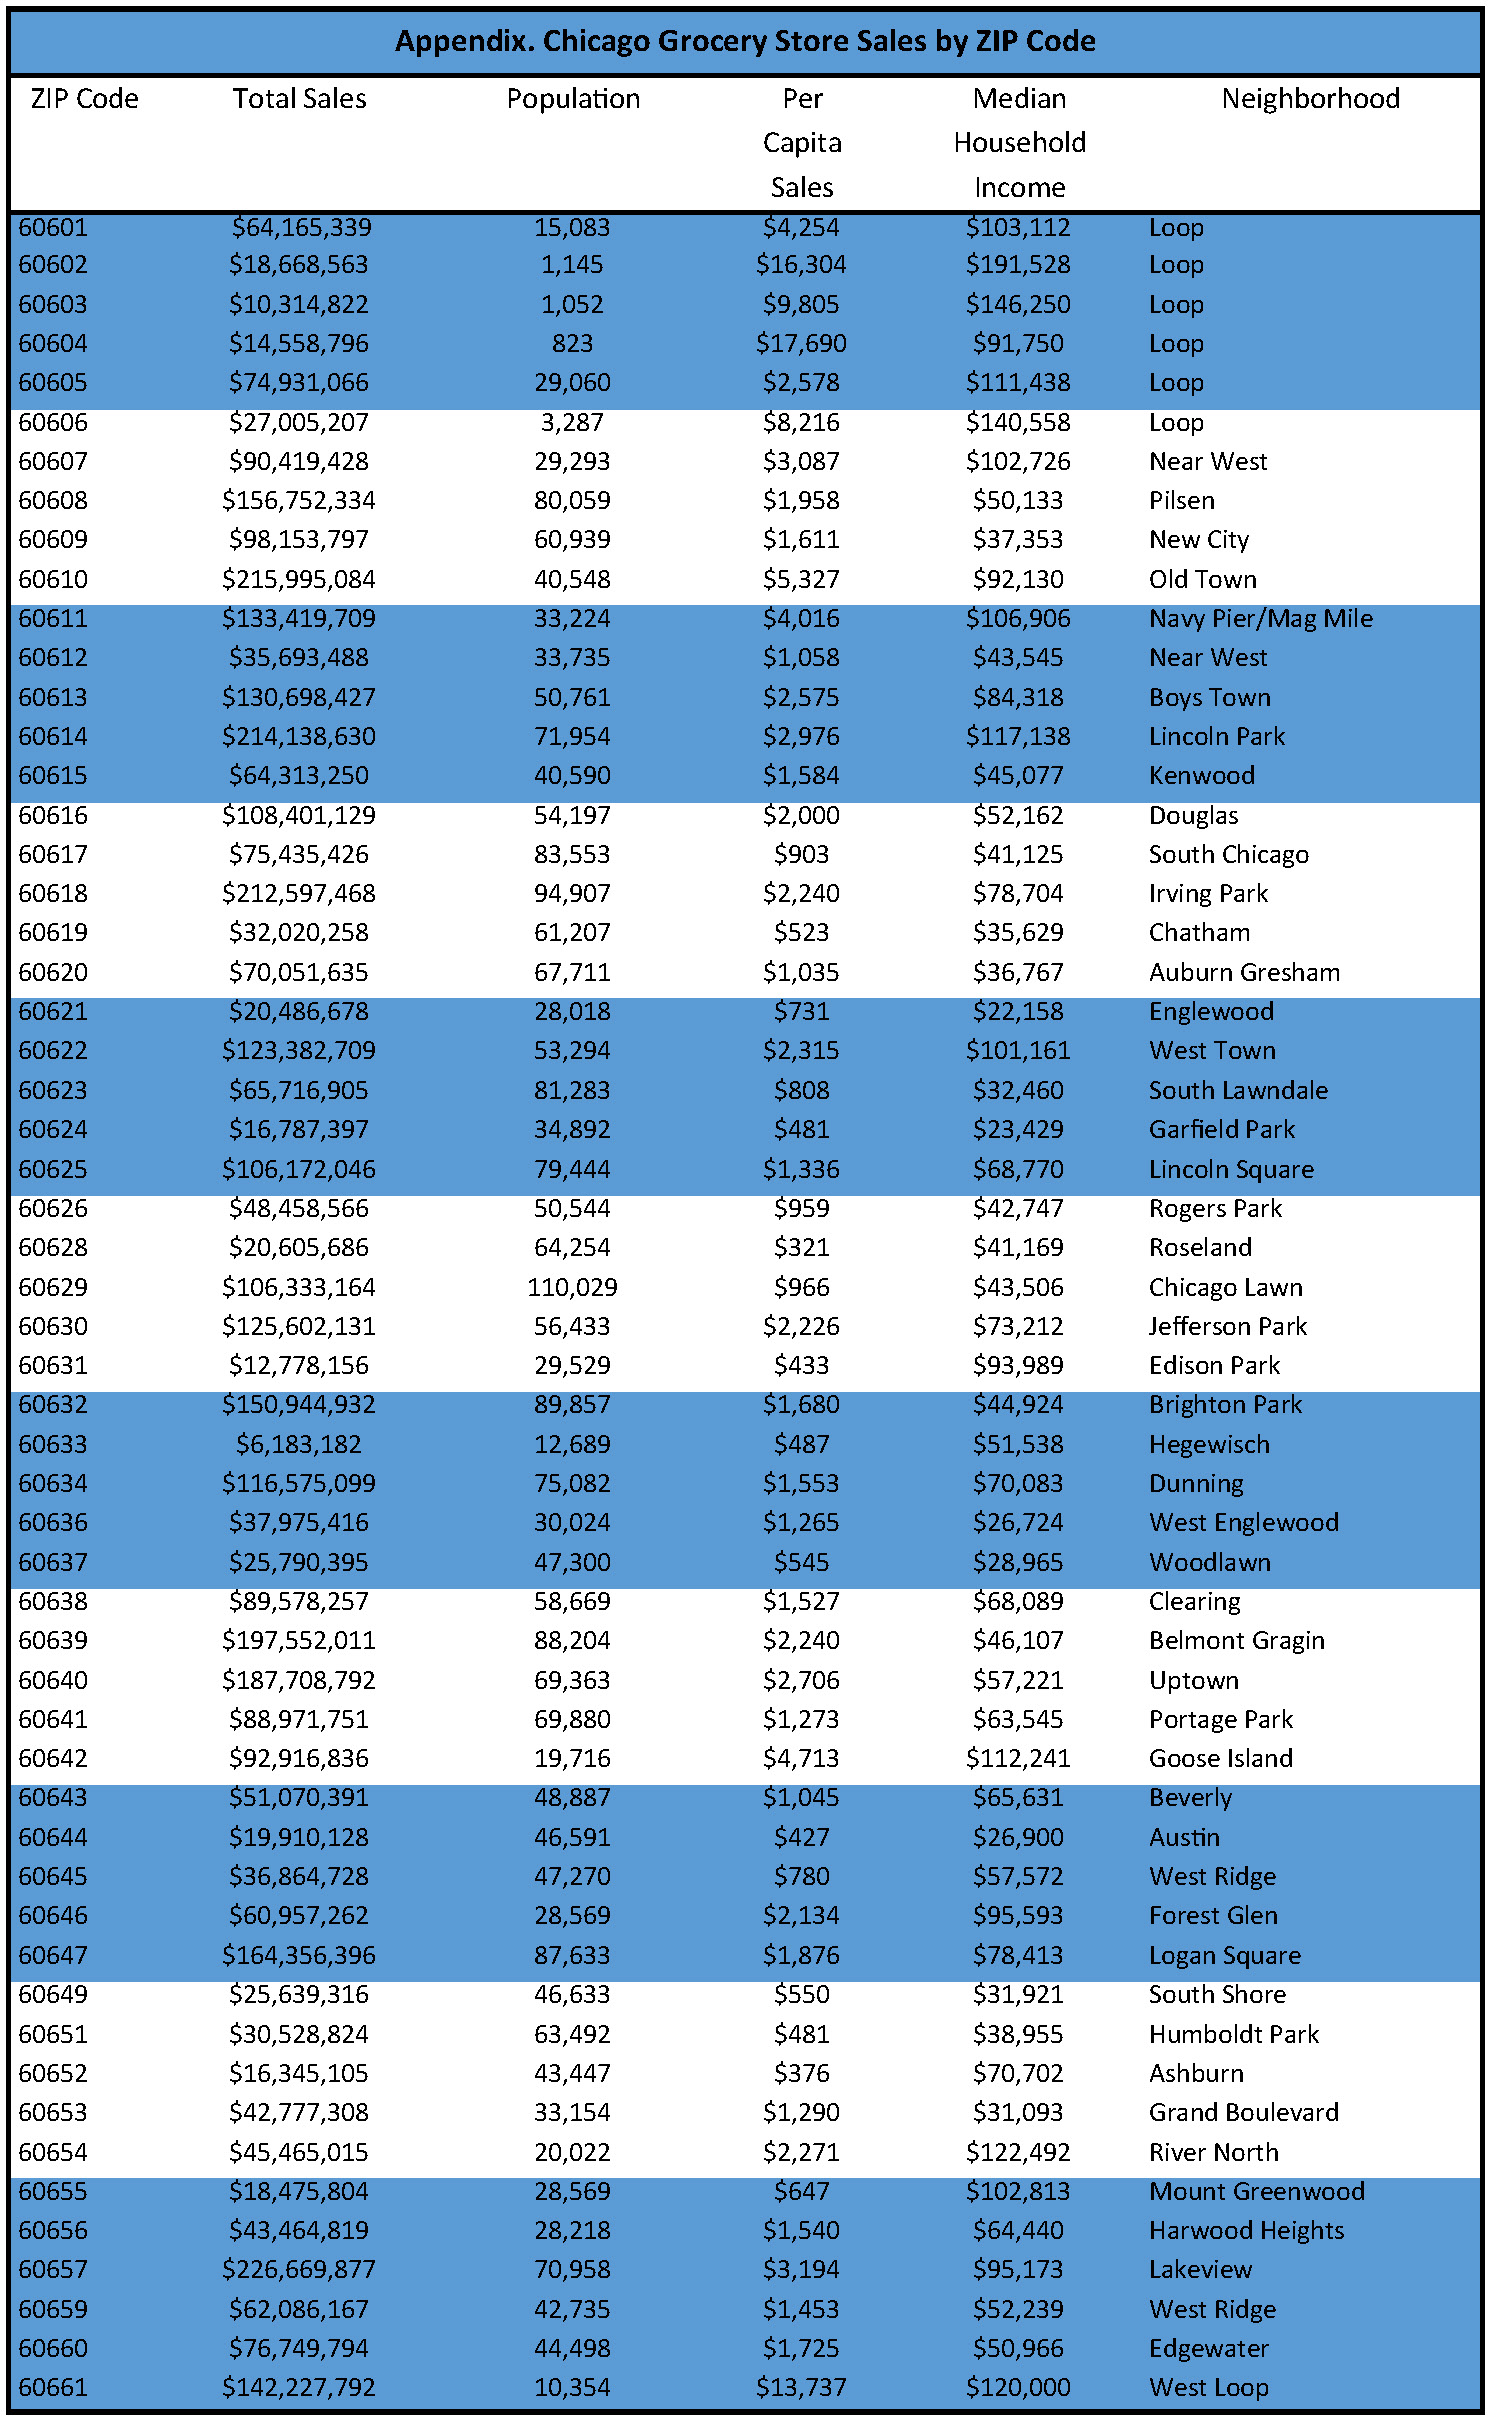
The Appendix at the end of this article includes all of the data we have for Chicago ZIP codes in 2019: total grocery store sales (the 1 percent municipal sales tax that applies to all purchases including groceries x 100), population, retail sales per capita, median household income, and neighborhood.
Per Capita and Total Grocery Store Sales
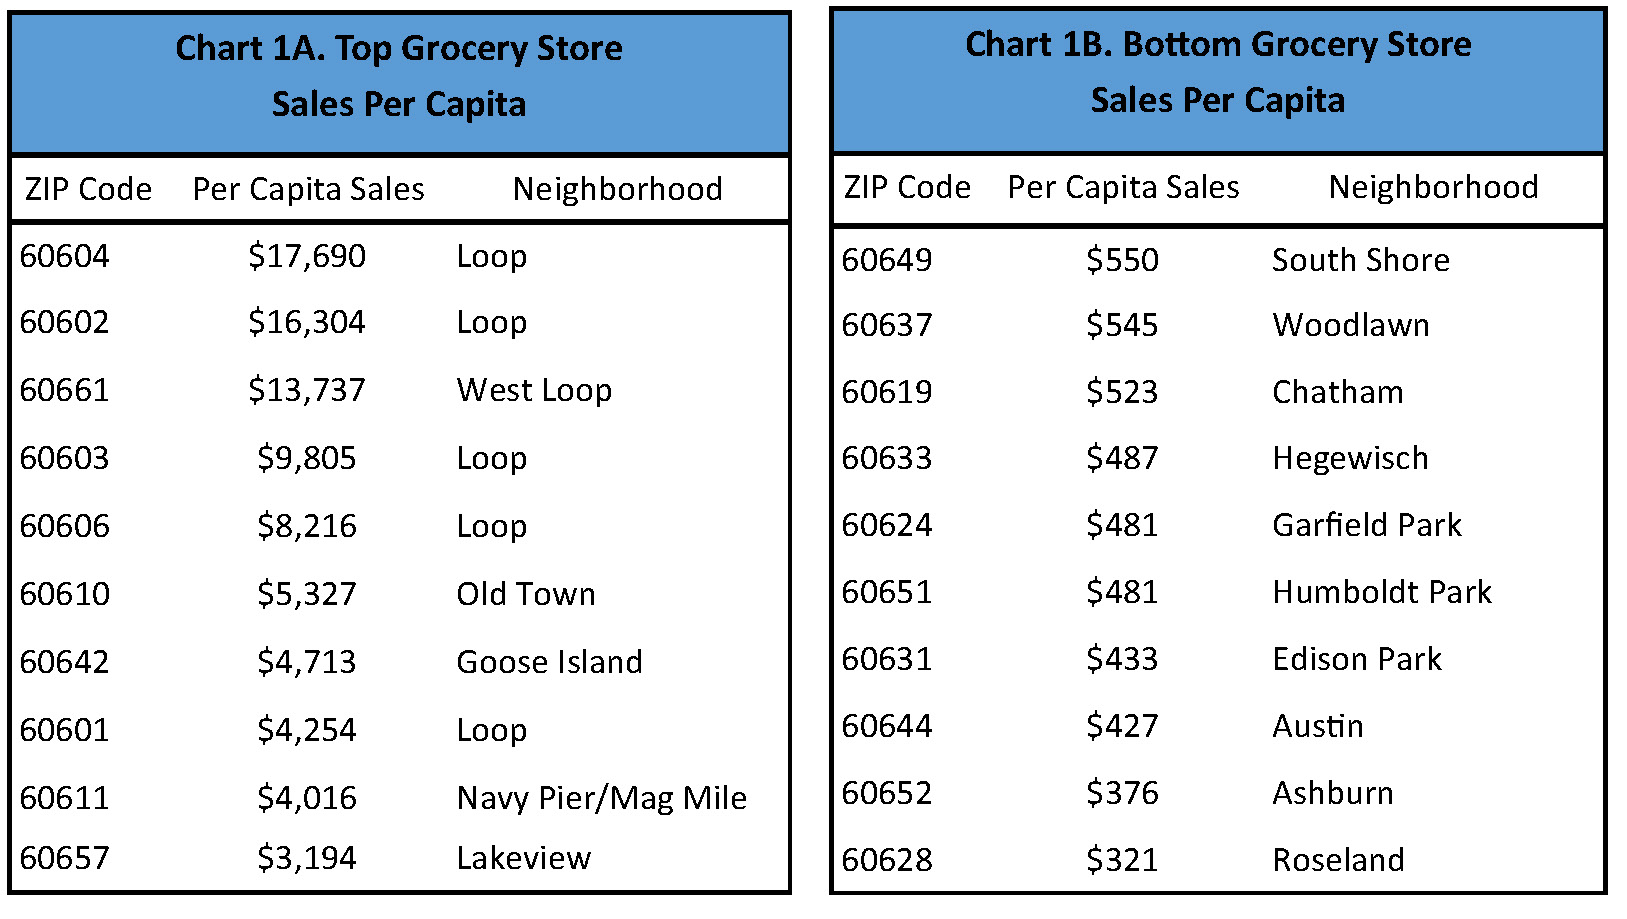
Within the city, per capita retail sales by grocery stores vary widely, from $17,690 per person in ZIP code 60604 (Loop) to $321 in ZIP code 60628 (Roseland). (The statewide average is $1,975.) The ZIP codes with the 10 highest and lowest per capita grocery sales are shown in Charts 1A and 1B. As was the case with all categories of retail sales by neighborhood, the Loop ZIP codes dominate, and the ZIP codes with the lowest per capita grocery store sales are primarily on the city’s south and west sides, where the limited retail presence (aka “food deserts”) has been a frequent topic of discussion in recent years.
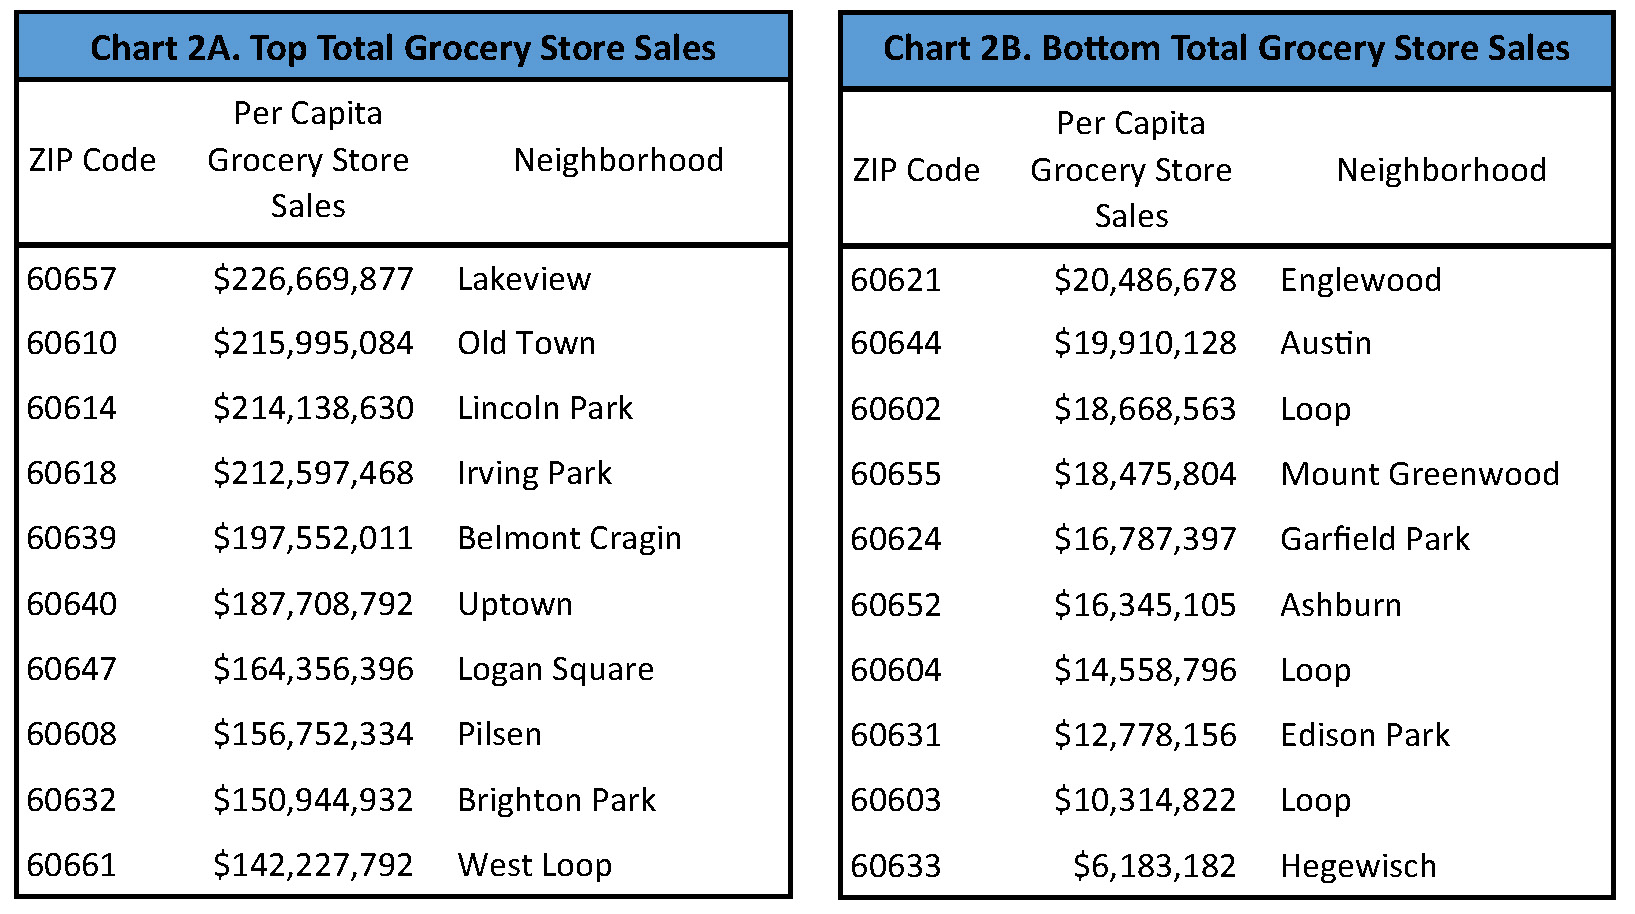
As we found when we looked at all categories of retail sales, ZIP codes with the highest per capita numbers were not the largest generators of total grocery store sales. The relatively low population numbers in the Loop ZIP Codes both drive up the per capita numbers and hold down total grocery sales. The ZIP codes with the 10 highest and the 10 lowest total grocery store sales are shown in Charts 2A and 2B. Predictably ZIP codes with the highest populations tend to have the highest grocery store sales. More people means more groceries in total, although not necessarily per capita. Only 60657 (Lakeview) and 60661 (West Loop) are in the Top 10 for both total grocery store sales and per capita grocery store sales, and three of the highest total grocery store sales ZIP codes (Logan Square, Pilsen, and Brighton Park) have per capita collections below the statewide average of $1,975.
Household Income and Grocery Store Sales
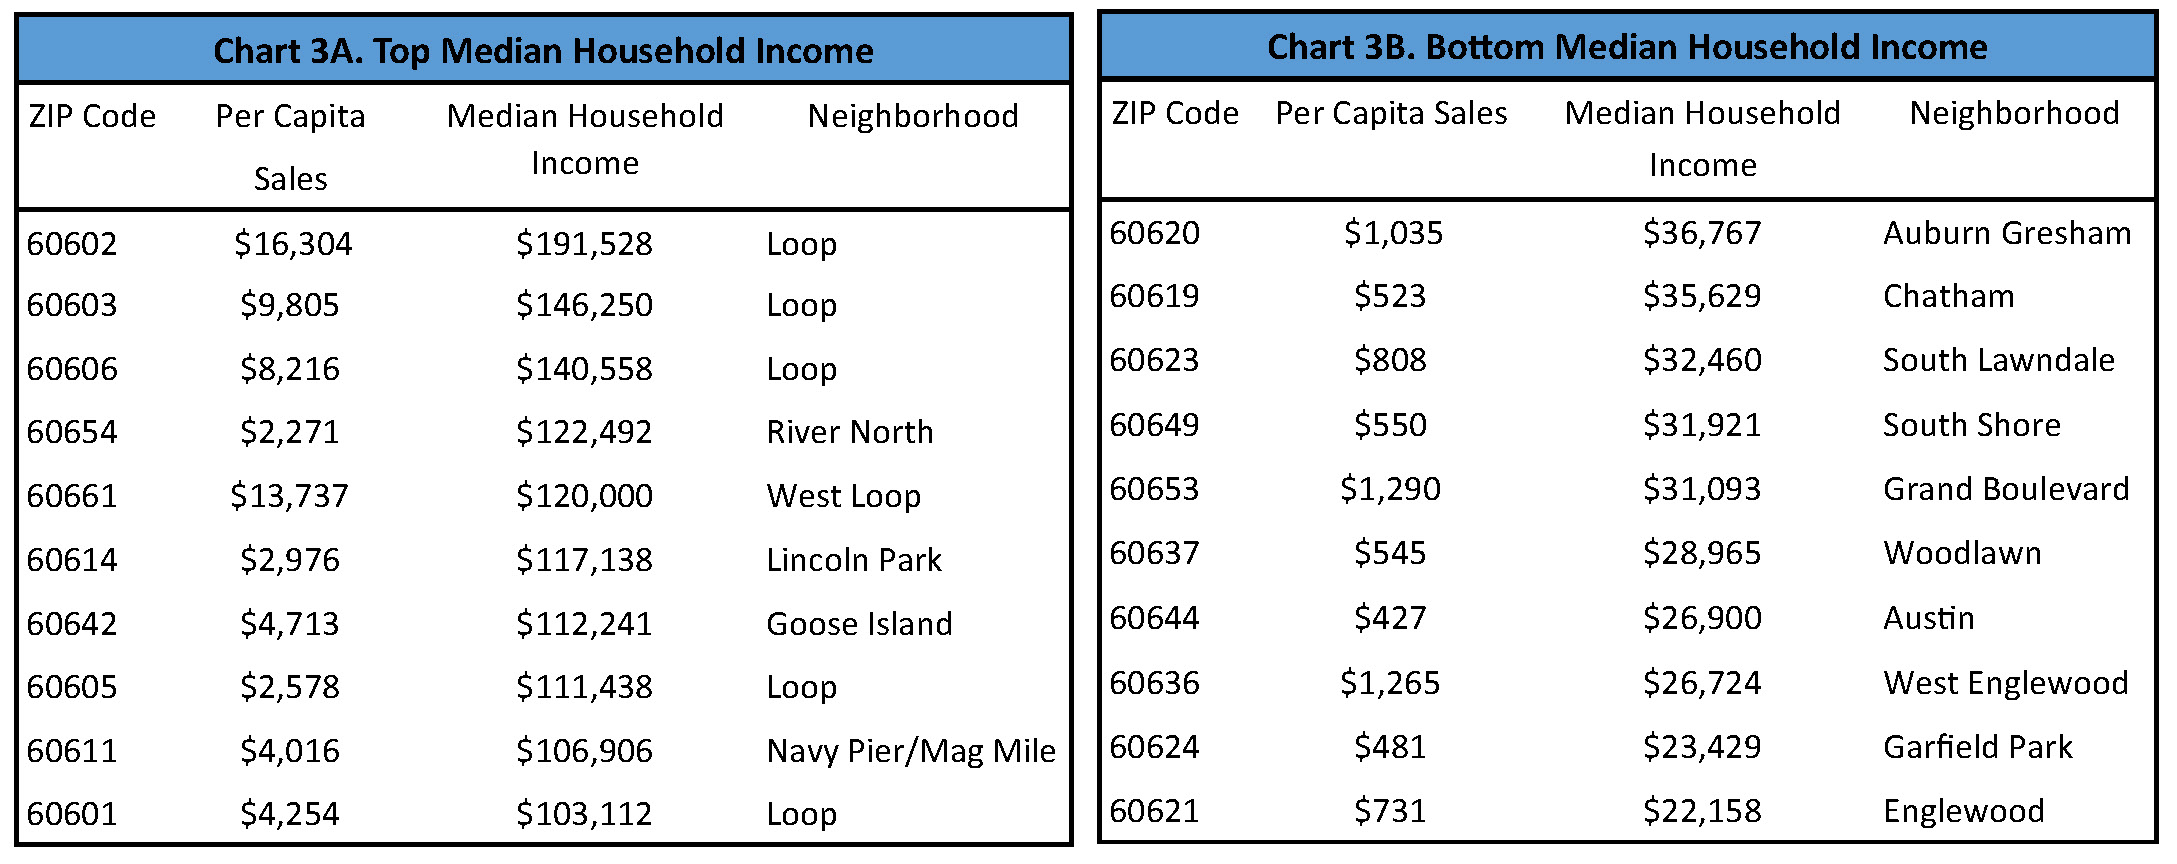
Finally we examine the tie between income and sales tax collections, using median household income from the Census Bureau. The ZIP codes with the 10 highest and lowest median household incomes are shown in Charts 3A and 3B. The average per capita grocery store sales for the 10 highest income neighborhoods is $6,887, compared to $766 for the 10 lowest income neighborhoods (well above and below, respectively, the statewide average of $1,975).
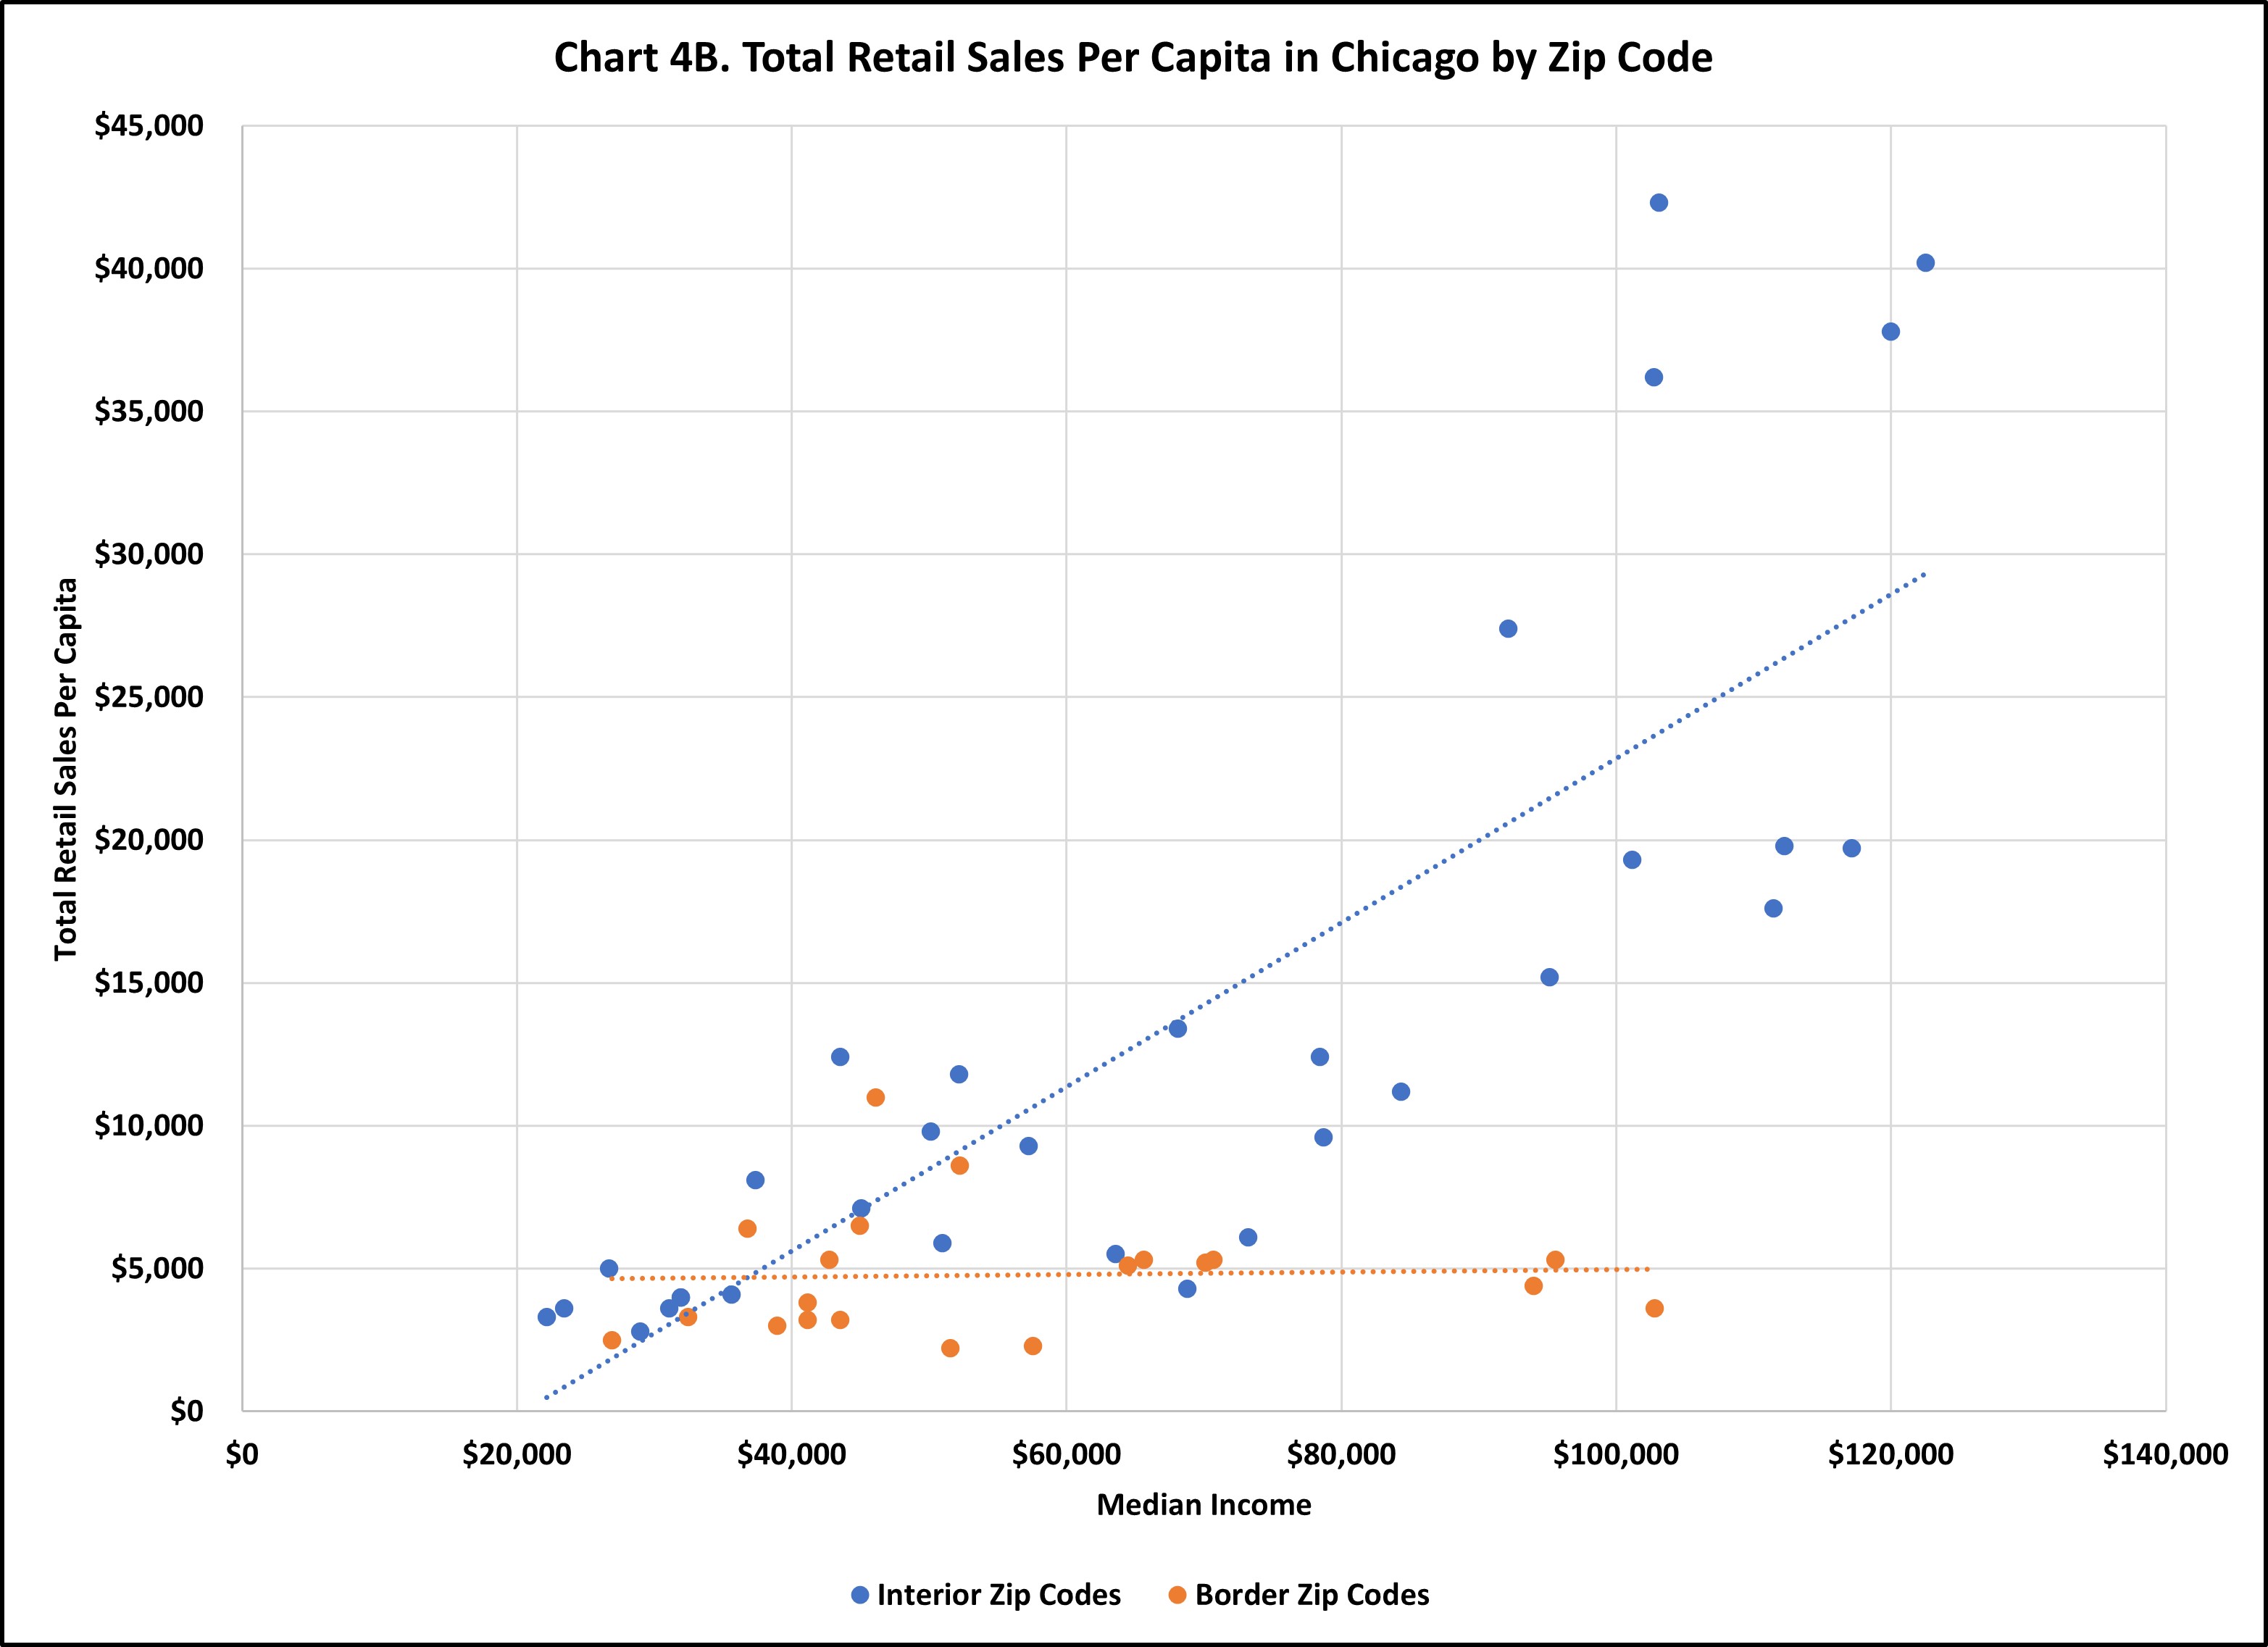
A clear visualization of the relationship can be seen in the scatter plot shown in Chart 4A. ZIP codes with high household incomes have high per capita grocery store collections—per capita sales increase as household incomes increase. (Chart 4B shows the same results looking at all taxable retail sales, not just grocery stores.)
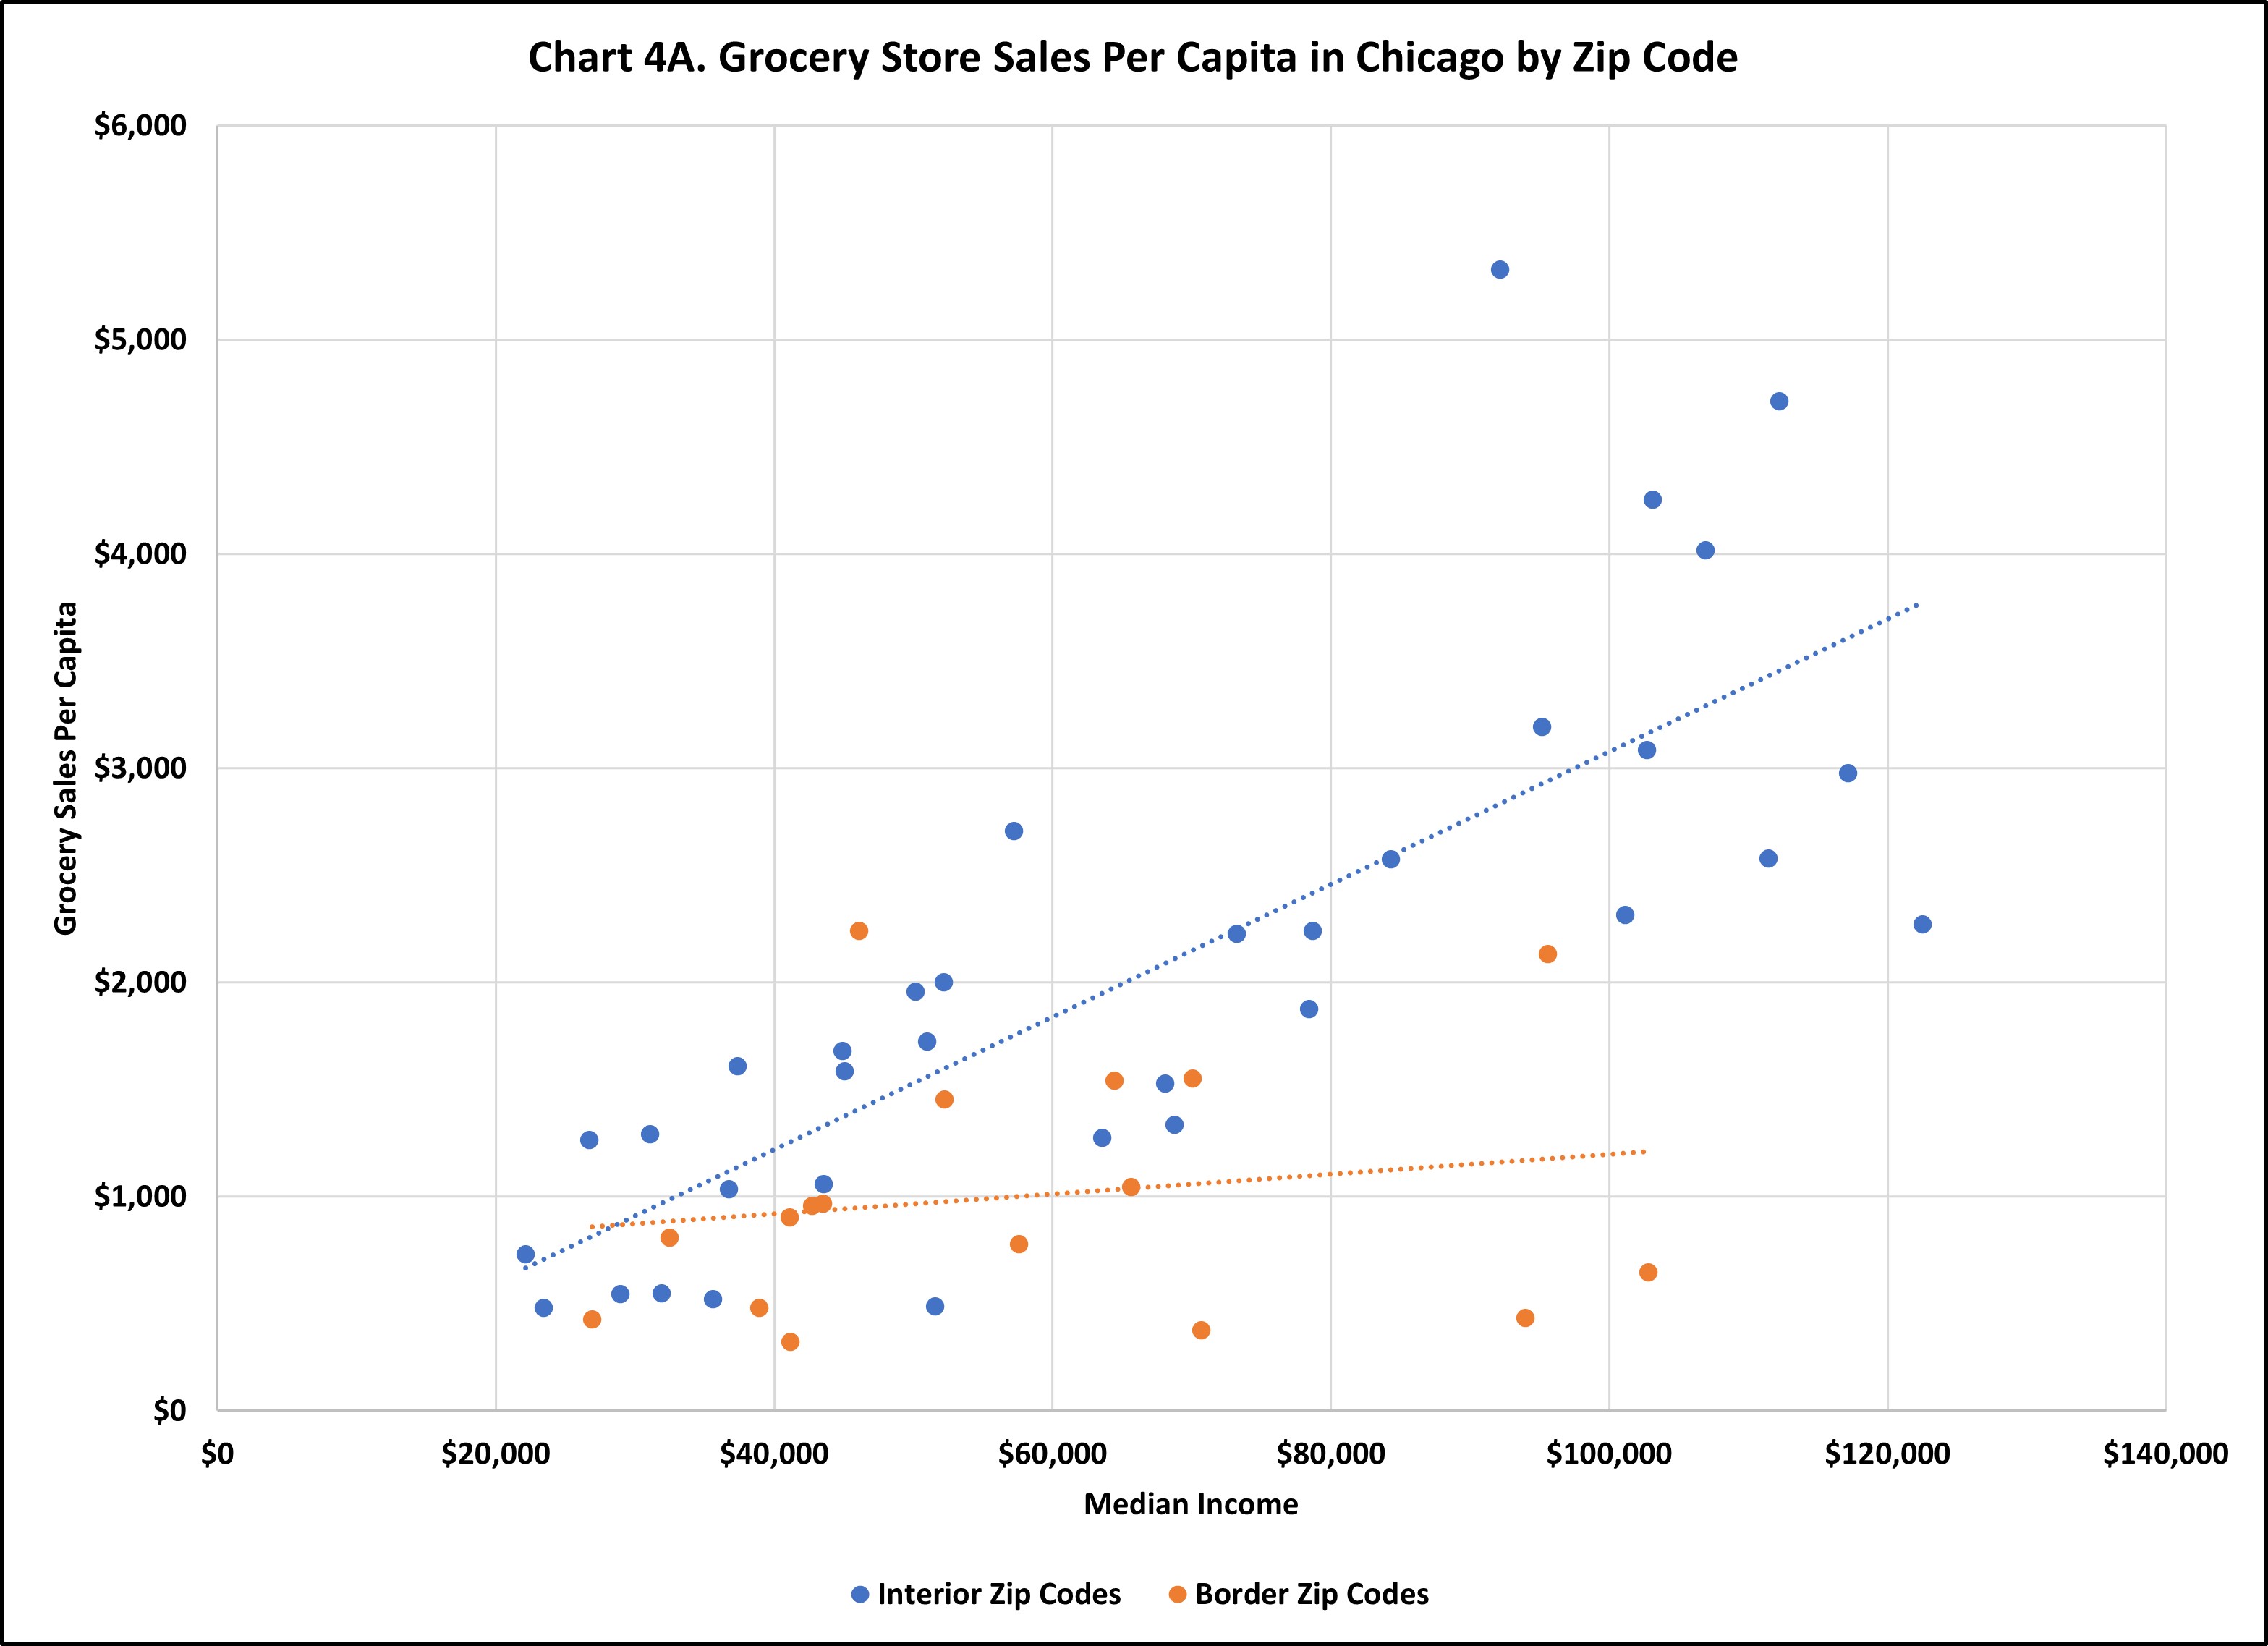
Note: We dropped 5 ZIP Codes (primarily in the Loop) from each chart because low population compressed the plot and obscured the trend.
As described above, our sales data is based on store location, not buyer’s residence, so these results are not a perfect indicator of the relationship between spending and income, but the correlation is strong enough to confirm our initial theory that Chicago’s lower-than-average household income levels are a contributing factor to its below-average per capita retail sales.
The Border Question
It all may seem pretty straightforward. Per capita grocery store sales track closely with income – higher income people can and do spend more on groceries. Total grocery store sales track with population – more people means more grocery stores. However, as in all things “tax,” there are complications. In ZIP codes 60655 (Mount Greenwood), 60631 (Edison Park), 60652 (Ashburn), 60645 (West Ridge), 60643 (Beverly), and 60641 (Portage Park), median household incomes are above the Chicago average and per capita grocery store sales below.
These neighborhoods are all close to the city border. It seems likely that their residents are leaving the city to purchase their groceries. This parallels an identical finding from September, when we looked at per capita retail sales by neighborhood. The orange dots in Charts 4A and 4B are border neighborhoods, and retail sales levels in those locations do not increase with income levels at the same rate as other city ZIP codes.
Conclusion
We set out to examine why Chicago’s per capita sales tax collections trail the statewide average given its tourism, entertainment, and business activity.
In August we found that because Chicago residents own fewer cars, sales tax collections from car sales and fuel purchases depress per capita collections. These retailers accounted for 11 percent of sales taxes in Chicago compared to 22 percent statewide.
In September we examined per capita retail sales in different Chicago neighborhoods and found, particularly in bars and restaurants, very strong sales in the Loop but below average sales in many other ZIP codes.
In this issue we tie retail sales to household income and find that higher income ZIP codes tend to have higher retail sales. We also find evidence that on the city borders residents are crossing out of Chicago to make purchases.
In summary, the retail sales generated by visitors to Chicago are significant, but do not offset the effects of fewer cars and a larger low-income population in the city.