What Illinois Sales Tax Tells us About the Economic Effects of Covid
What Illinois Sales Tax Tells us About the Economic Effects of Covid
July 2021 (74.4)
by Maurice Scholten and Mike Klemens*
Retail sales have been a well-documented casualty of the COVID pandemic as shops, restaurants and bars have been forced to transform the way they do business, or close. That change has also affected governments that rely on sales tax receipts to fund their operations. Although the sales tax hit has been less than initially anticipated, it has varied by community. In this article we will use statistics from the Illinois Department of Revenue to examine how the pandemic has impacted Illinois state and local governments and different types of retailers.
Illinois’ complex system of state and local sales taxes – technically a combination of occupation taxes imposed on retailers and use taxes imposed on buyers (the buyer ends up paying both) – provide a closer look at retail sales. The system has two different tax bases: (1) general merchandise and vehicles, which are taxed at the high rate (the 6.25 percent state rate plus local add-ons) and (2) groceries, drugs, and medical appliances, which are taxed at the low rate (1 percent plus Regional Transportation Authority add-ons in Cook and the Collar Counties). The shorthand for the two bases is “general merchandise” or “high rate” on the one hand, and “food and drugs” or “low rate” on the other.
The Illinois Department of Revenue administers more than 20 separate state and local “sales” taxes and keeps the data by location to be able to allocate the local portion to the appropriate taxing jurisdiction. It also has information on the kinds of businesses collecting the tax. This information offers insights as to what happened in Illinois during the COVID pandemic.
In the early days of the pandemic, on April 15, 2020, Illinois’ Office of Management and Budget revised sharply downward its latest estimate for sales taxes for the remaining two months of FY 2020 and for all of FY 2021. For FY 2021 OMB took its sales tax estimate from $9.038 billion to $7.453 billion. Sales tax collections did better for both years and will end up exceeding the pre-COVID projection for FY 2021.
Illinois was in no way unique, and sales taxes came in better than initially thought in states across the country. In the FY 2022 budget presentation in February, OMB attributed the improved FY 2021 numbers to federal stimulus payments, job losses concentrated in lower paying positions, consumers spending money on taxable goods instead of non-taxable services, pent up demand after lockdowns were eased, and development of delivery and curbside pick-up options.
Overall Effect
One way to look at the effect of COVID is to look at collections of various “sales” taxes imposed on different tax bases. Because of natural fluctuations, i.e. retail sales jump during the Christmas holiday and back to school seasons, and fall off in January and February, we compare monthly collections in 2020 to the same month in 2019. In each case we refer to the month the purchase was made, not when the tax was collected by the Department of Revenue.
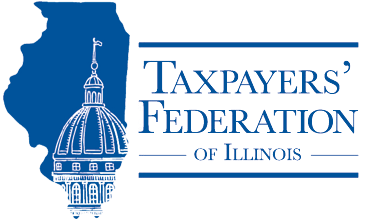
The numbers show that state Retailers’ Occupation Tax collections (5 percent out of the 6.25 percent state rate on general merchandise – but not groceries or drugs – sold by Illinois retailers) fell beginning in March of 2020, and by December had yet to return to pre-COVID levels. See Chart 1. That’s no surprise, given fear of COVID and restrictions on gatherings.
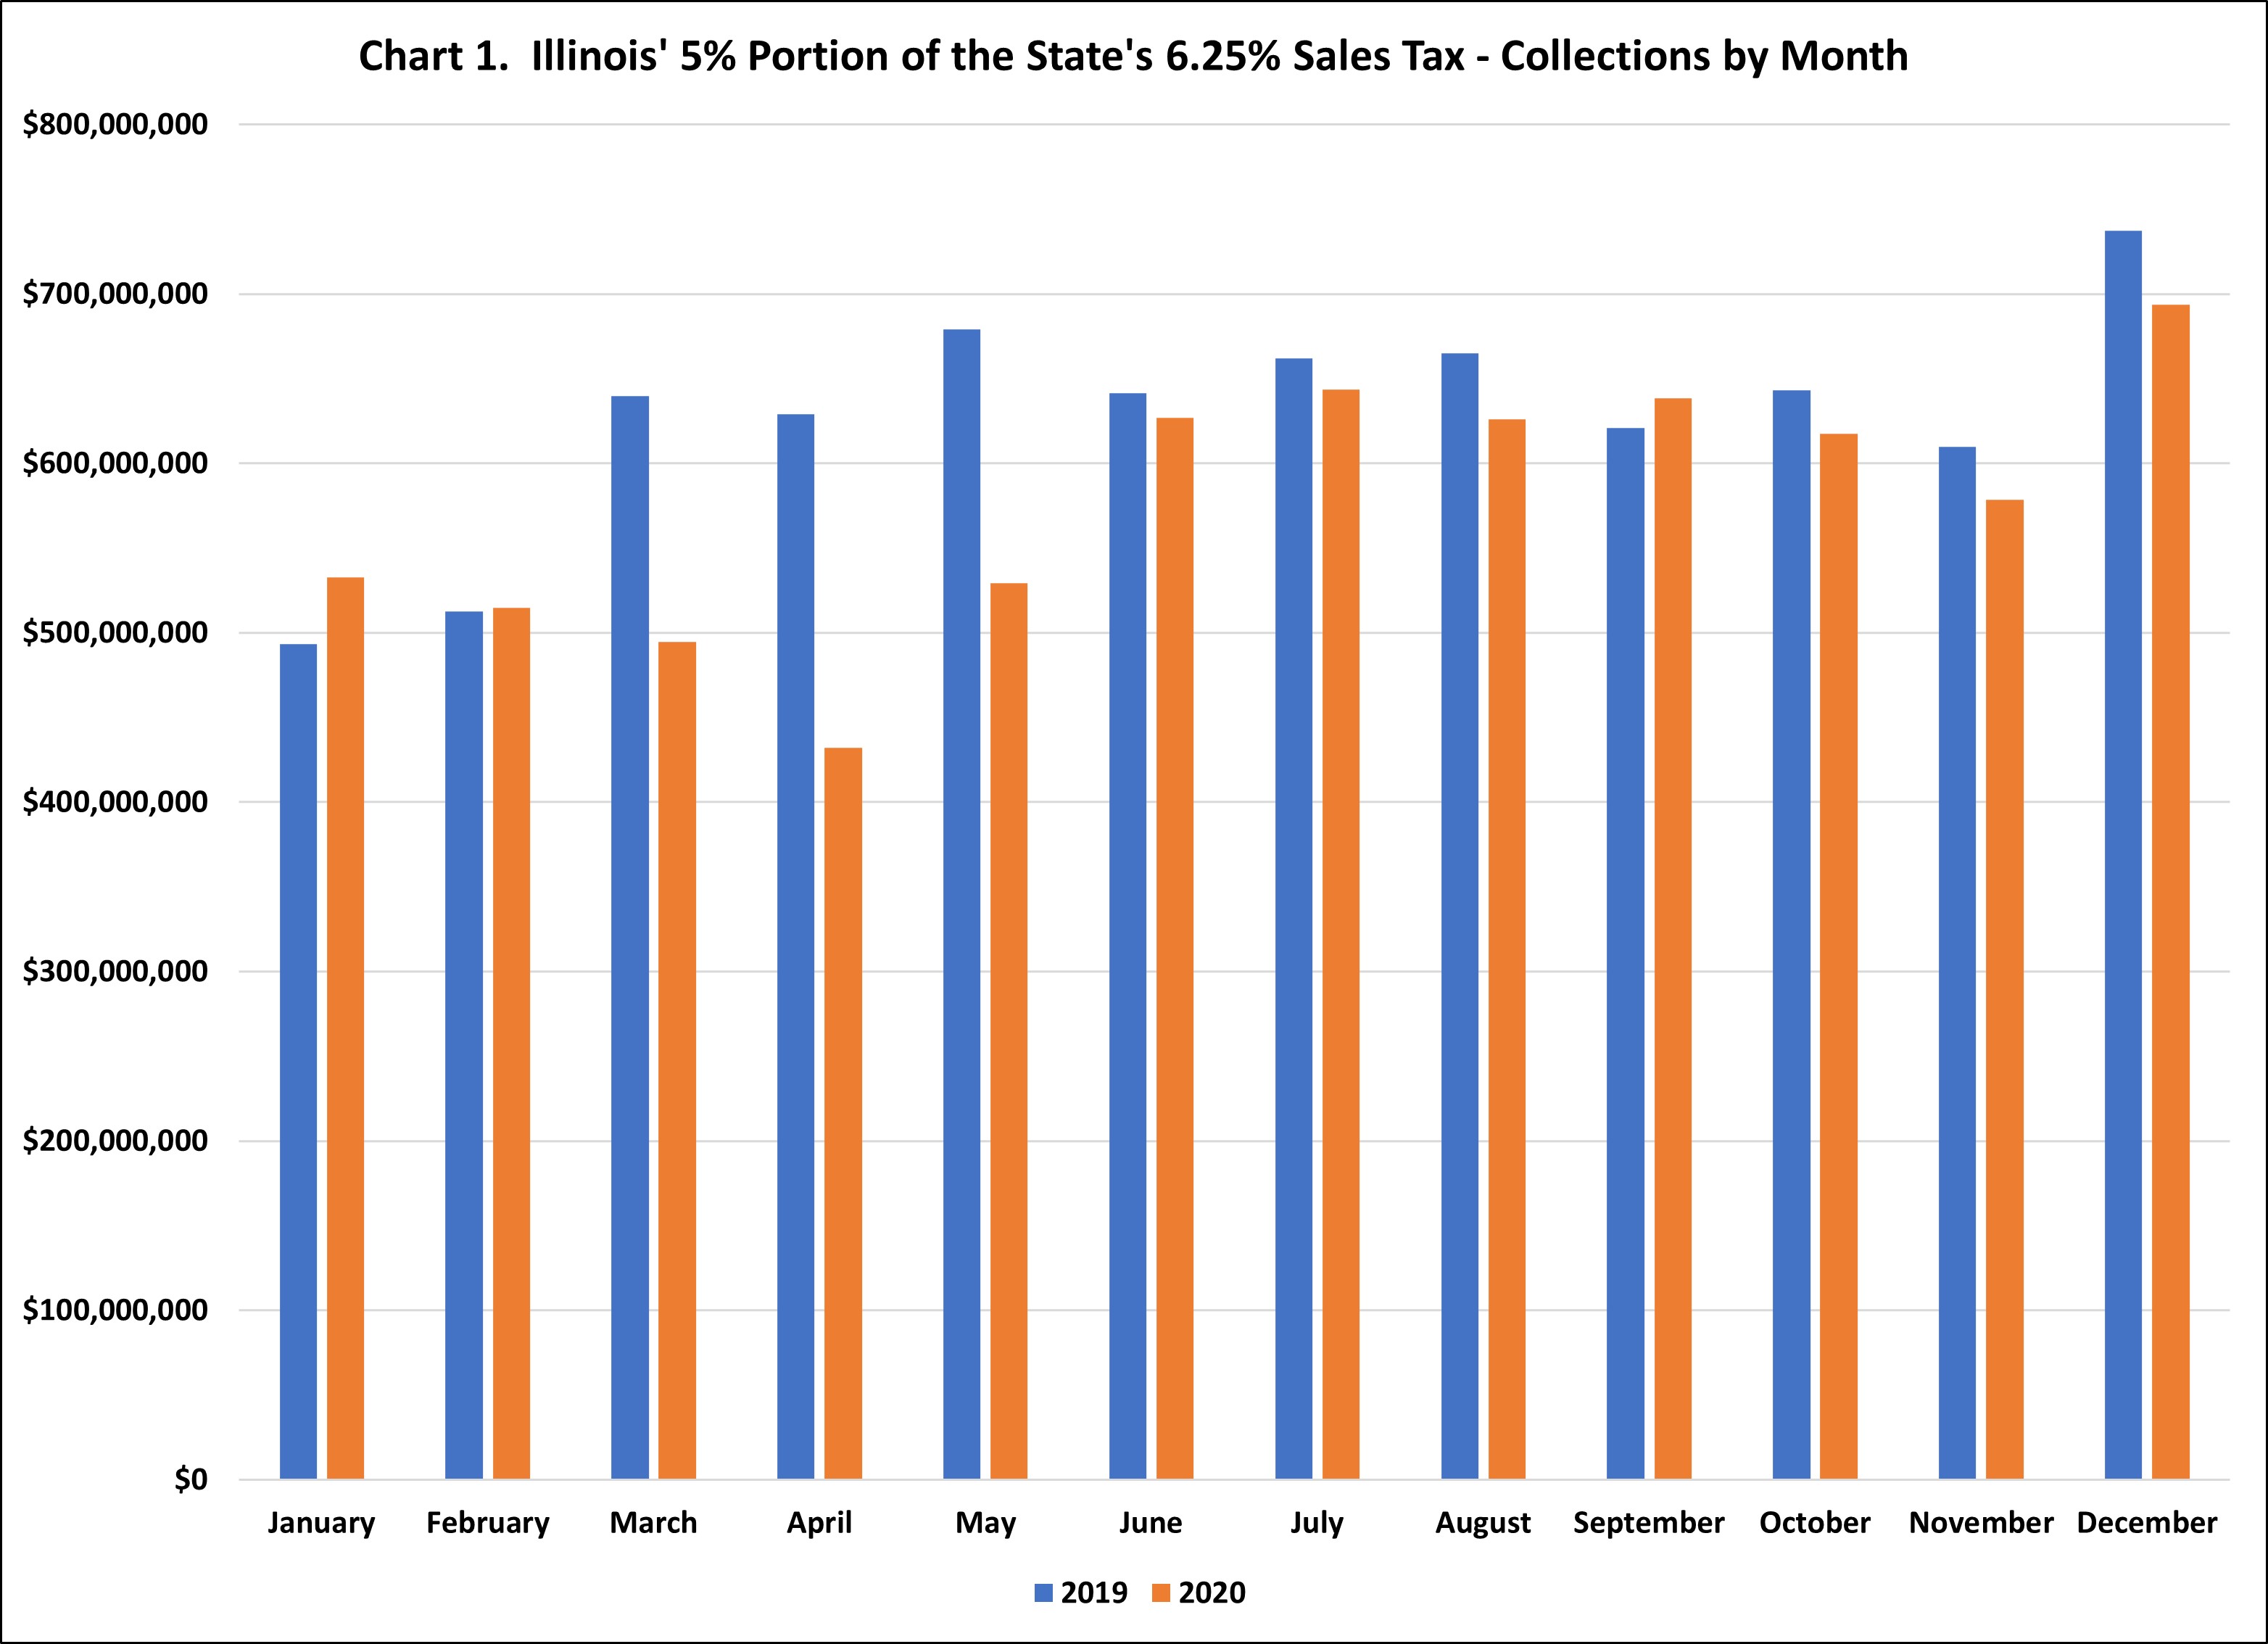
However, Illinois Use Tax Collections, imposed at the same 5 percent rate on the same base as the ROT but on sales by retailers outside Illinois, already on the increase as Illinois moved to require out of state retailers to administer its Use Tax after the Supreme Court’s Wayfair decision, jumped up significantly in April and continued at that higher level. See Chart 2.That’s no surprise either, to those who have seen the growing number of delivery trucks in our neighborhoods.
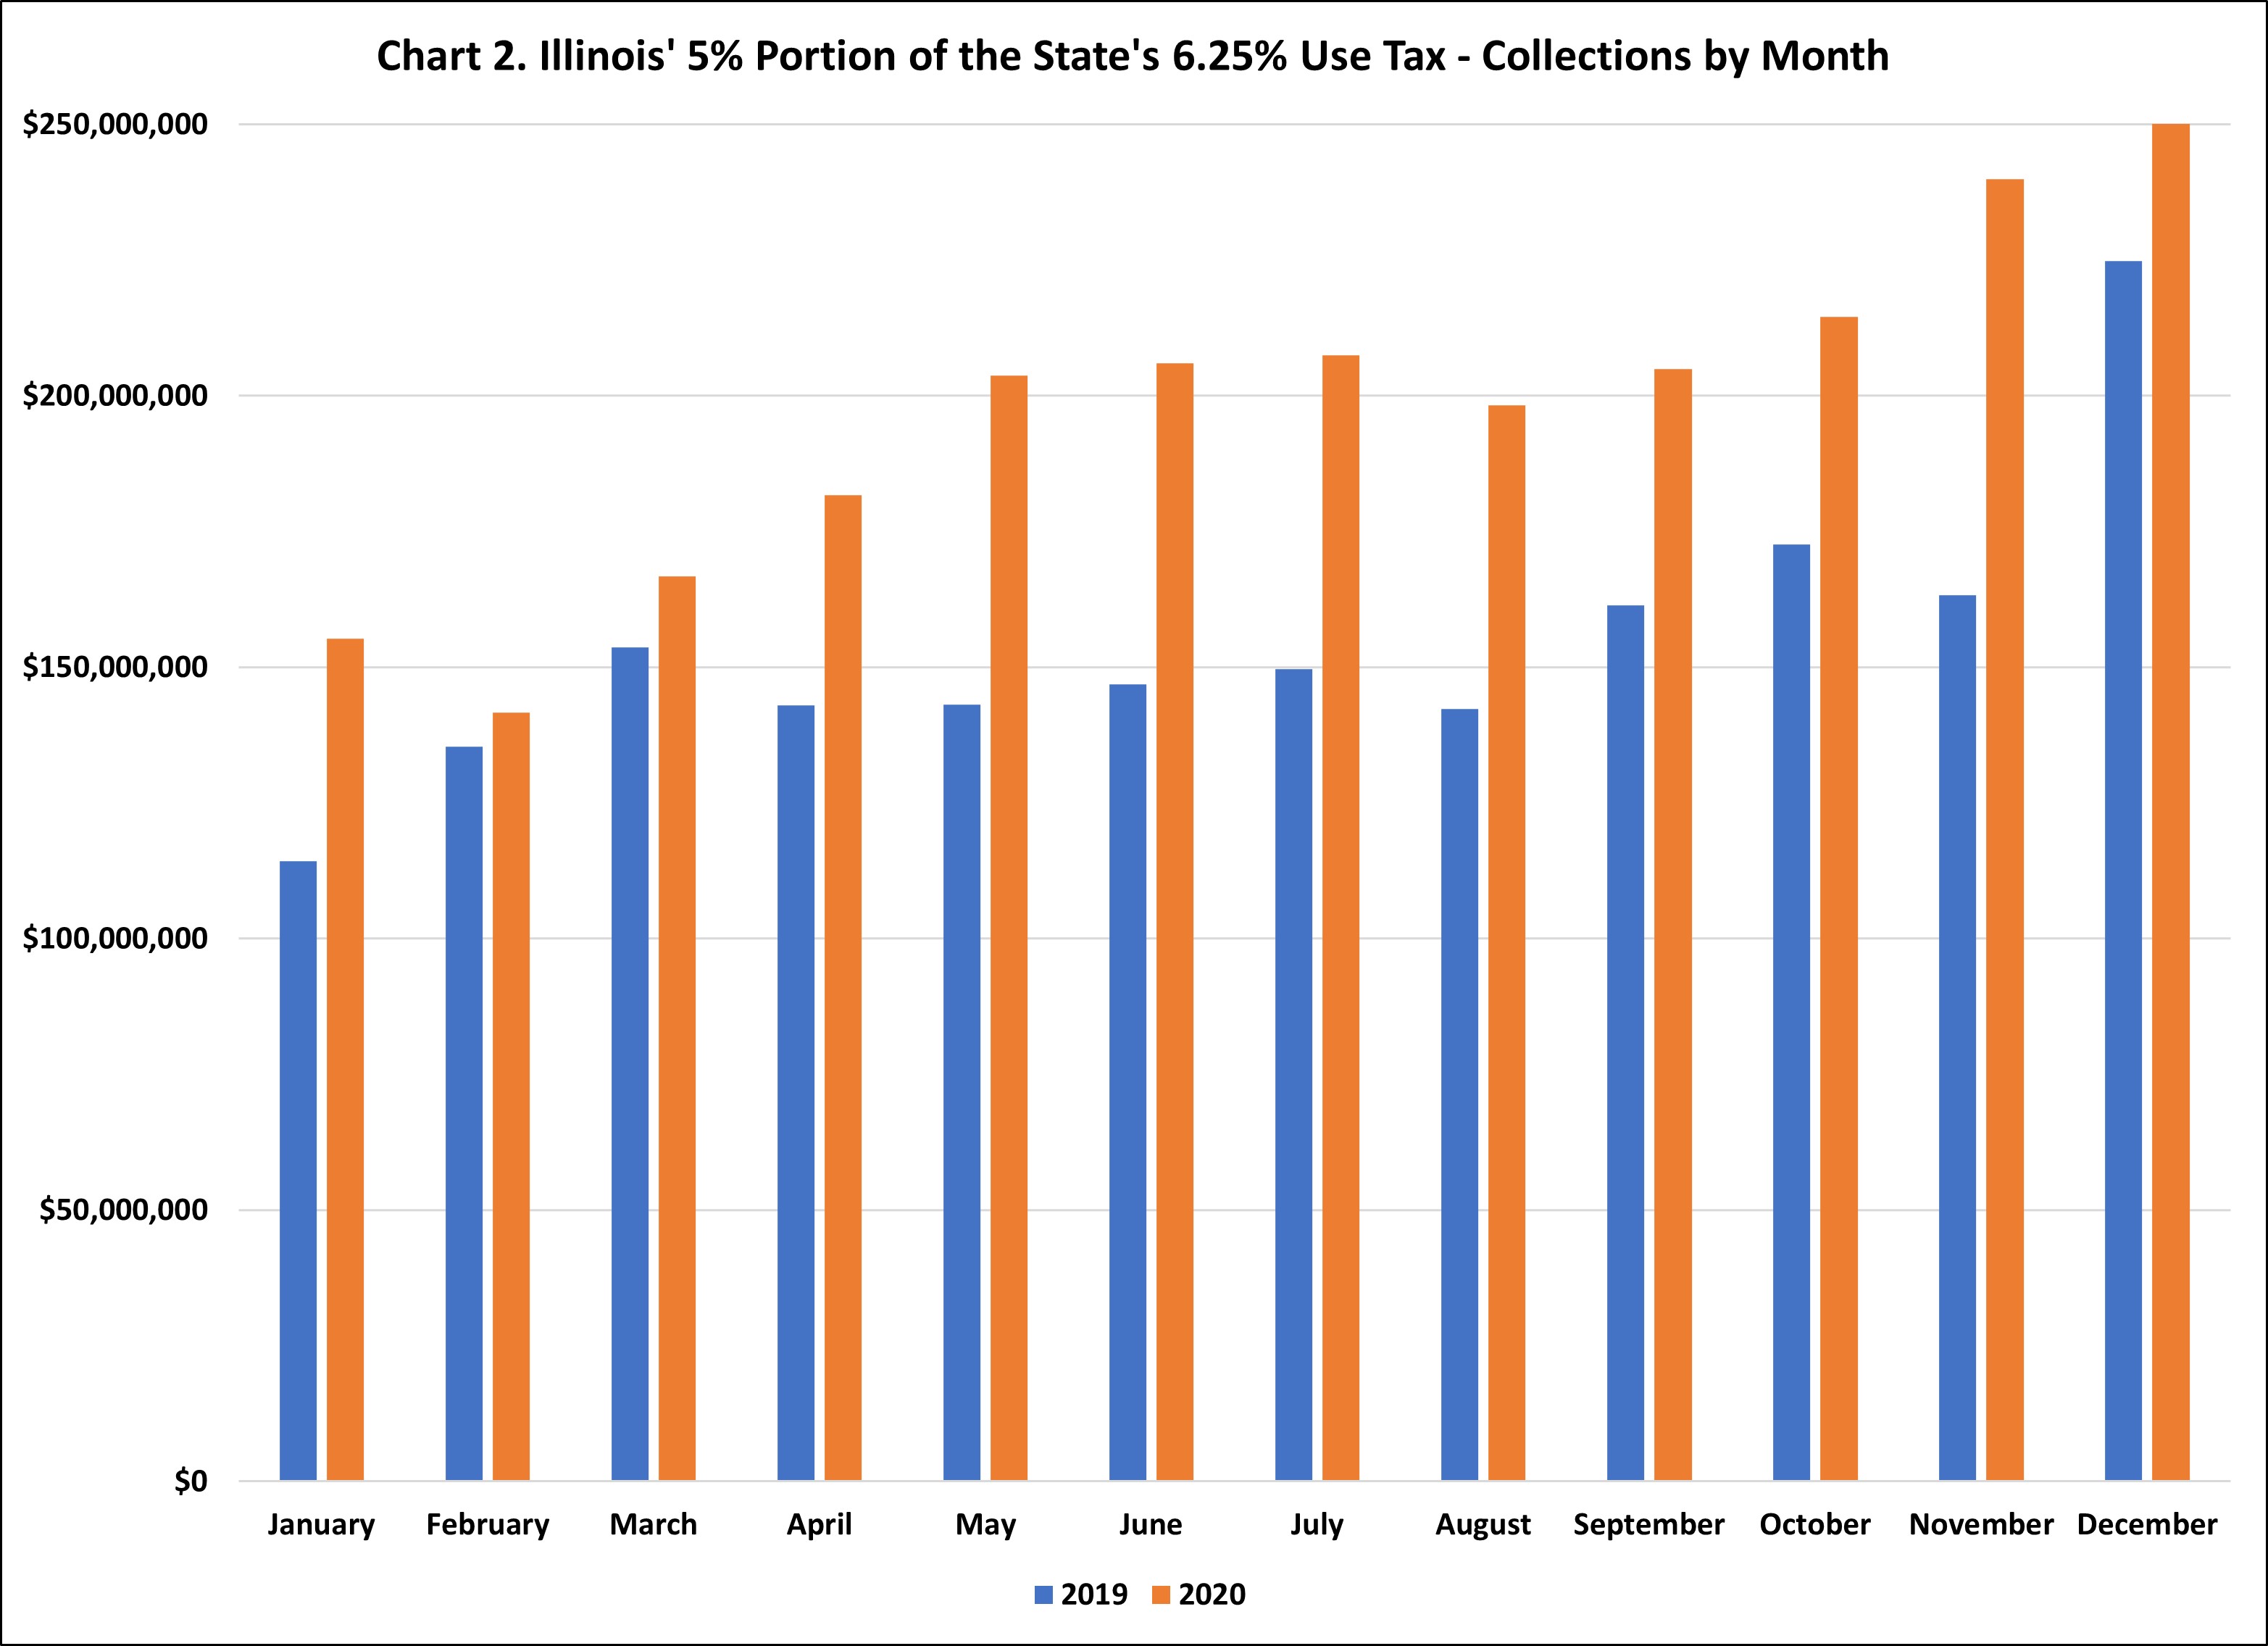
Taken together, state ROT and Use Tax collections were down year over year between March and May but have grown since then. Given that Use Tax collections were trending upward before the pandemic, we can’t distinguish between Wayfair and COVID related increases, but it appears there was substitution of local purchases to online. See Chart 3.
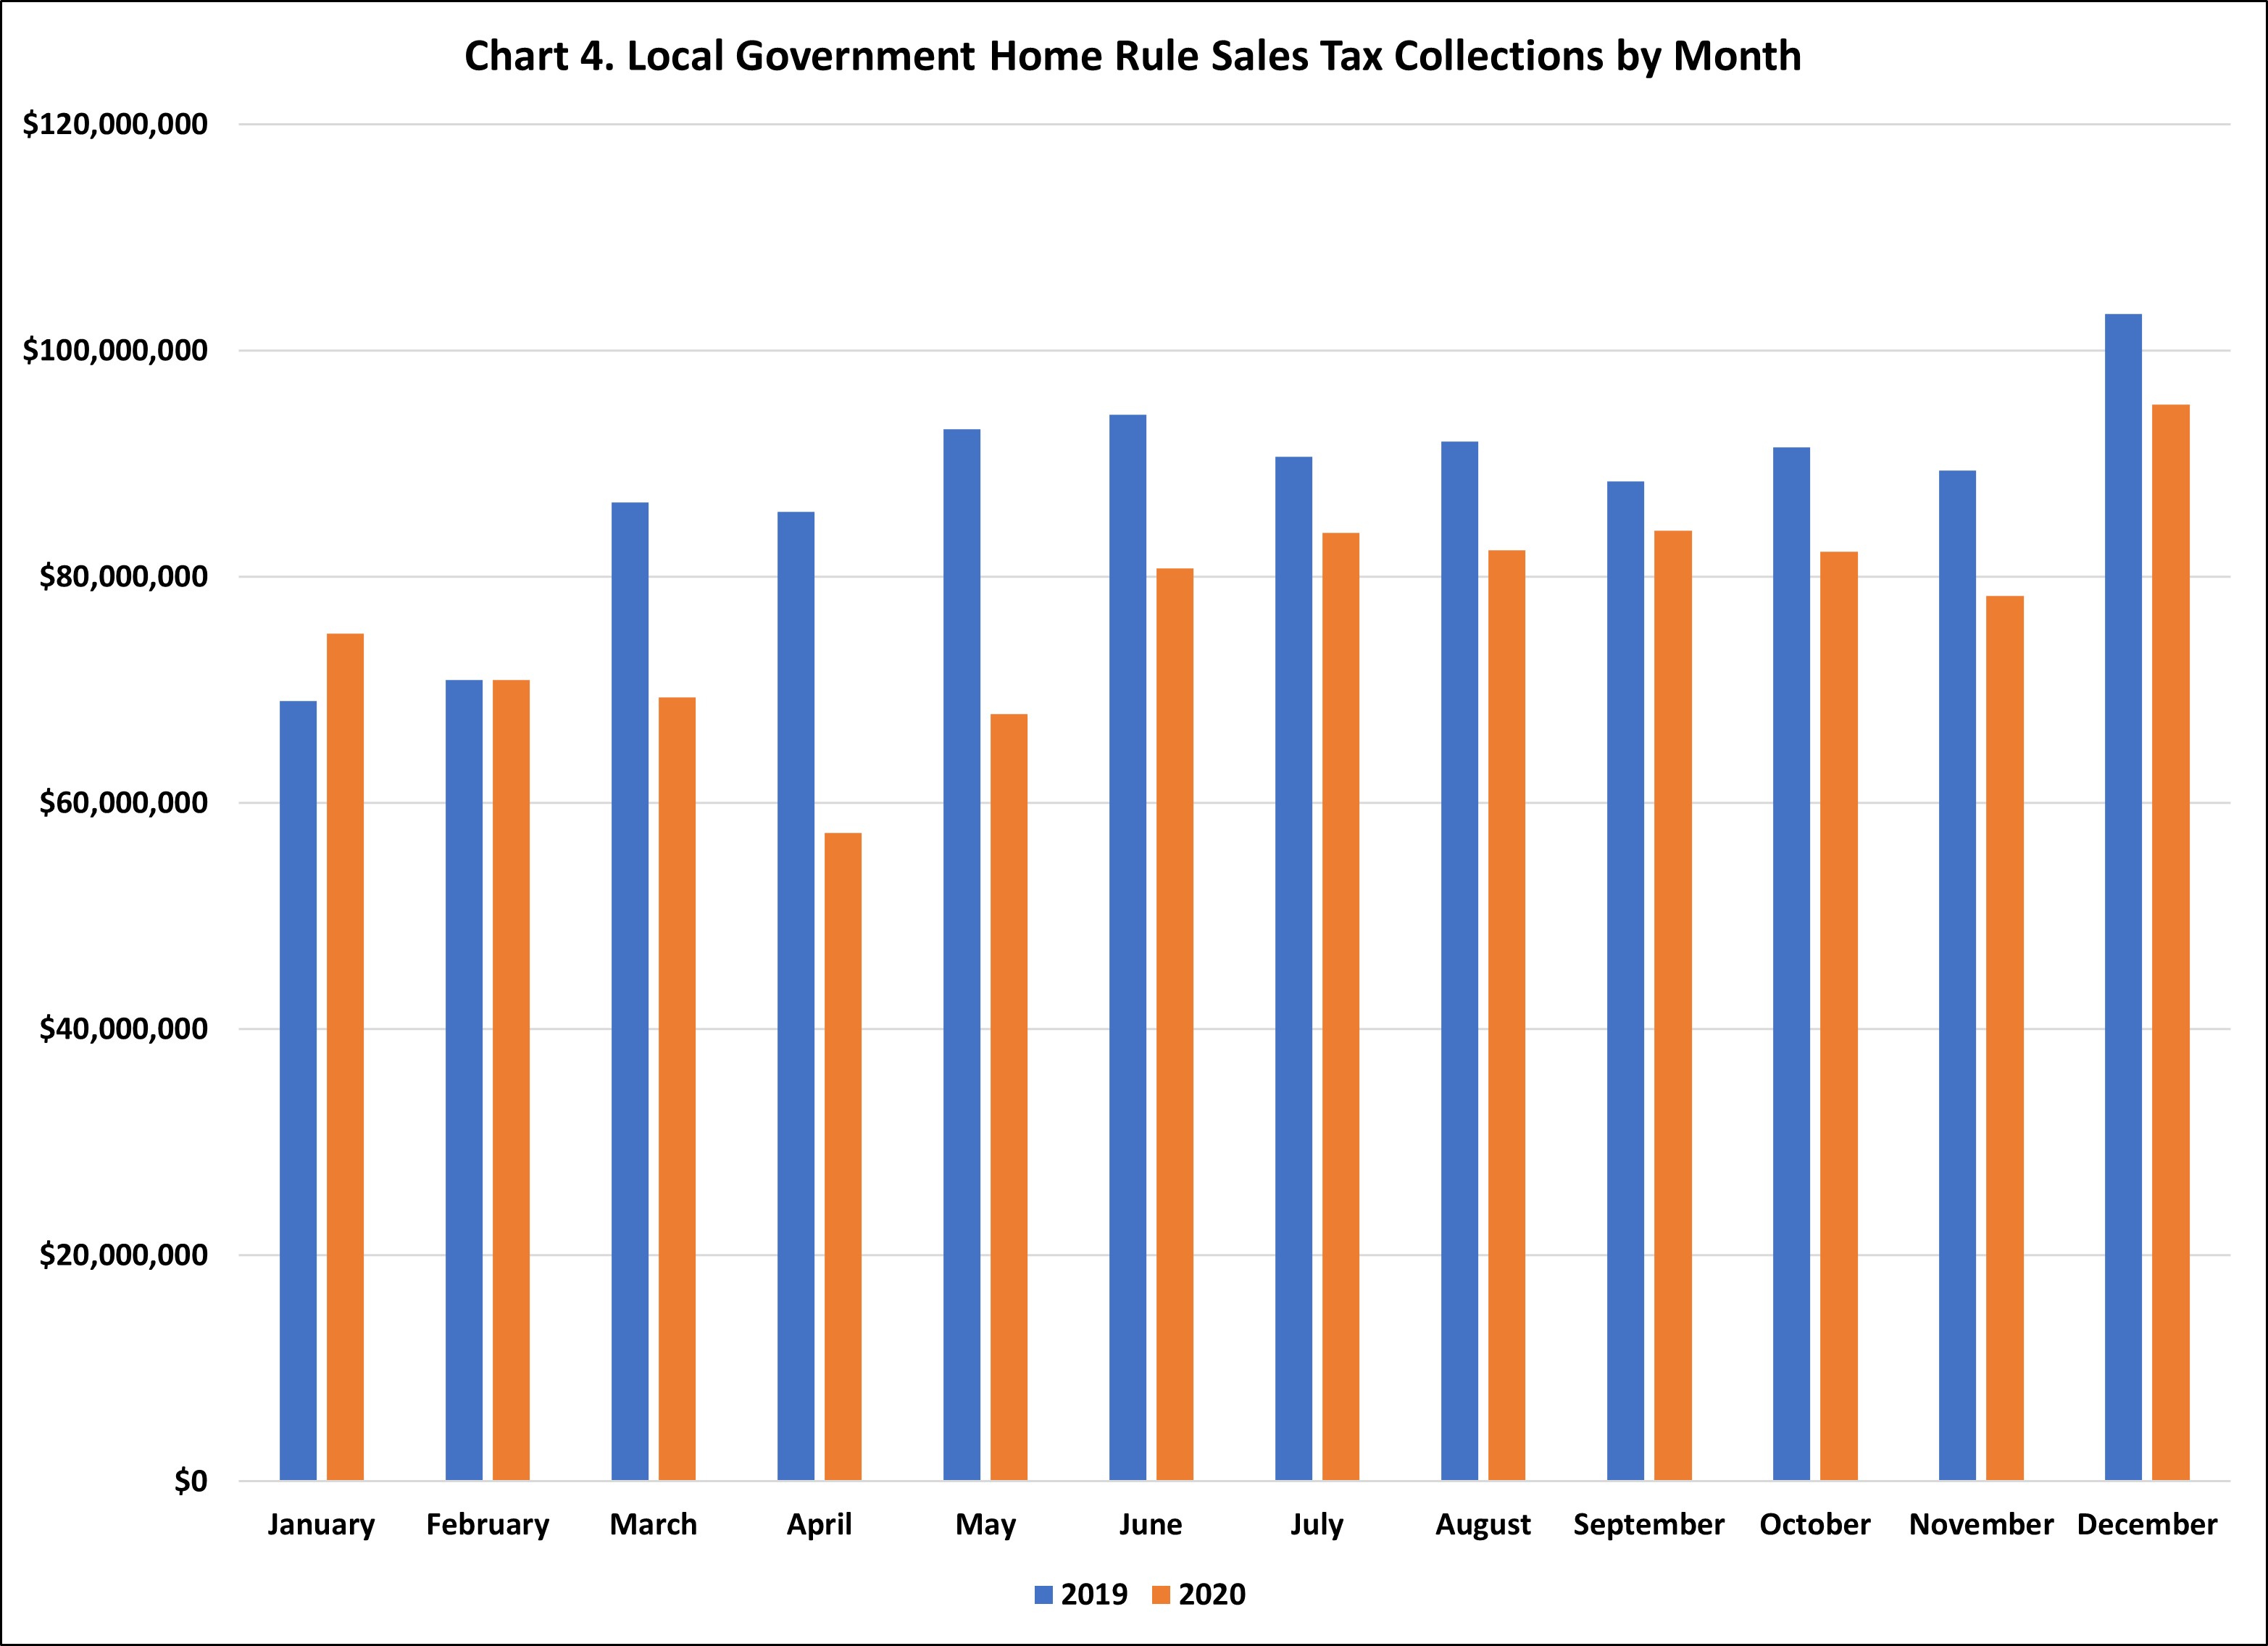
Local governments that impose home rule Retailers’ Occupation Taxes have fared worse in terms of collections, however, because there is no Use Tax associated with home rule taxes and home rule taxes do not apply to the more stable groceries and drugs. Home rule taxes have declined year over year each month since March. See Chart 4. The state has enacted new legislation, the Leveling the Playing Field for Illinois Retail Act, that seeks to impose ROT collection responsibilities (and higher rates) on remote retailers, effective in January of 2021. There are questions as to whether certain aspects of that Act would survive a legal challenge, but no such challenges have yet been filed.
Impact by Type of Business
Department of Revenue data published by the type of business provides a second insight. It’s important to note that the Standard Industrial Code (SIC) represents the classification of the retailer, not of the object being sold. Grocery stores sell non-grocery items, while drug stores sell groceries and lots of non-pharmaceutical items. Nevertheless, the trends are clear in Chart 5, which shows change in collections compared to the same month the previous year.
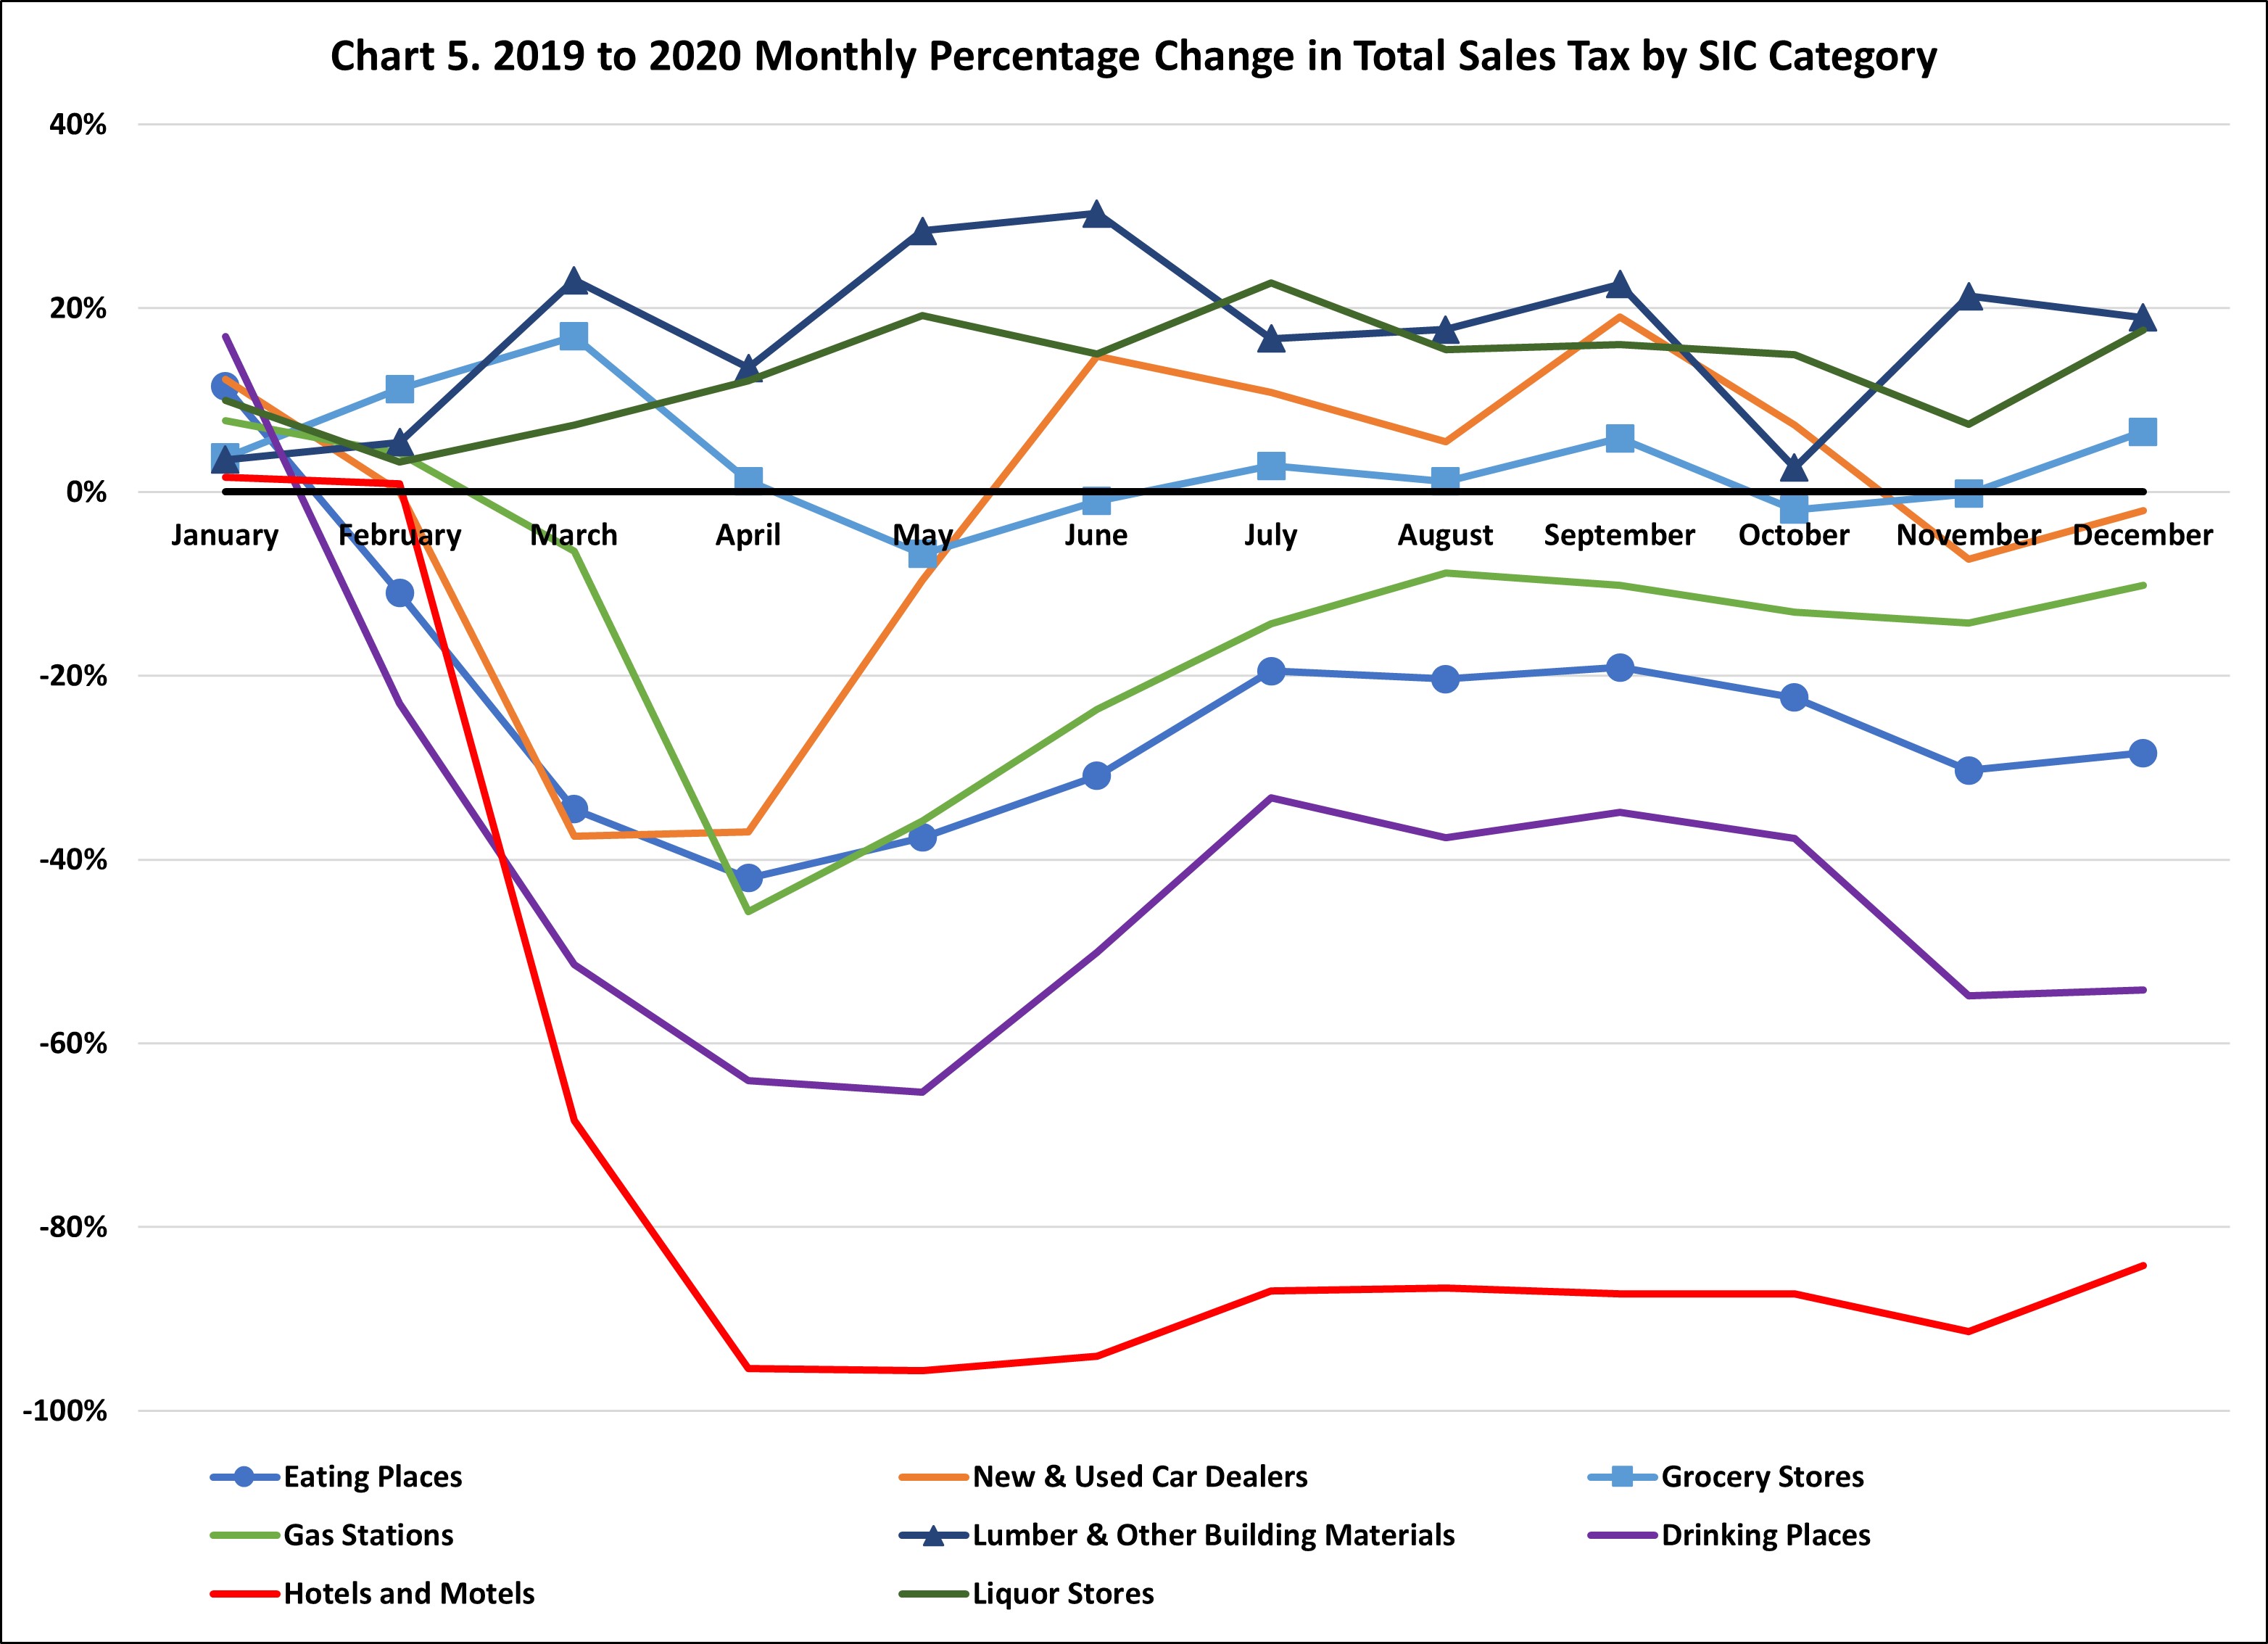
Hotels and motels saw a precipitous decline in sales taxes collected as COVID struck and have not significantly recovered, as did restaurants and bars. On the other hand, while car dealers and gas stations took an initial hit, they quickly recovered and by the end of the year were close to their previous year’s level. Grocery stores saw an initial increase that then flattened out. Building supply sellers and liquor stores have consistently performed above their pre-Covid levels.
Impact in Different Cities
A third impact we can explore from the IDOR data is geographical. It’s important to remember that more than 40 percent of sales taxes imposed in Illinois flow to local governments at a wide range of tax rates. In addition to 1.25% of the 6.25% state-wide tax, municipalities can, and many do, impose their own tax. Local add-on sales taxes range from the 0.25 percent non-home rule sales tax in Burr Ridge to a 2.75 percent home rule sales tax in Mount Vernon. For each time the pandemic forced a family to skip a $100 night at the local pizza joint, Burr Ridge would miss out on $1.25 in taxes while Mount Vernon would lose $3.75.
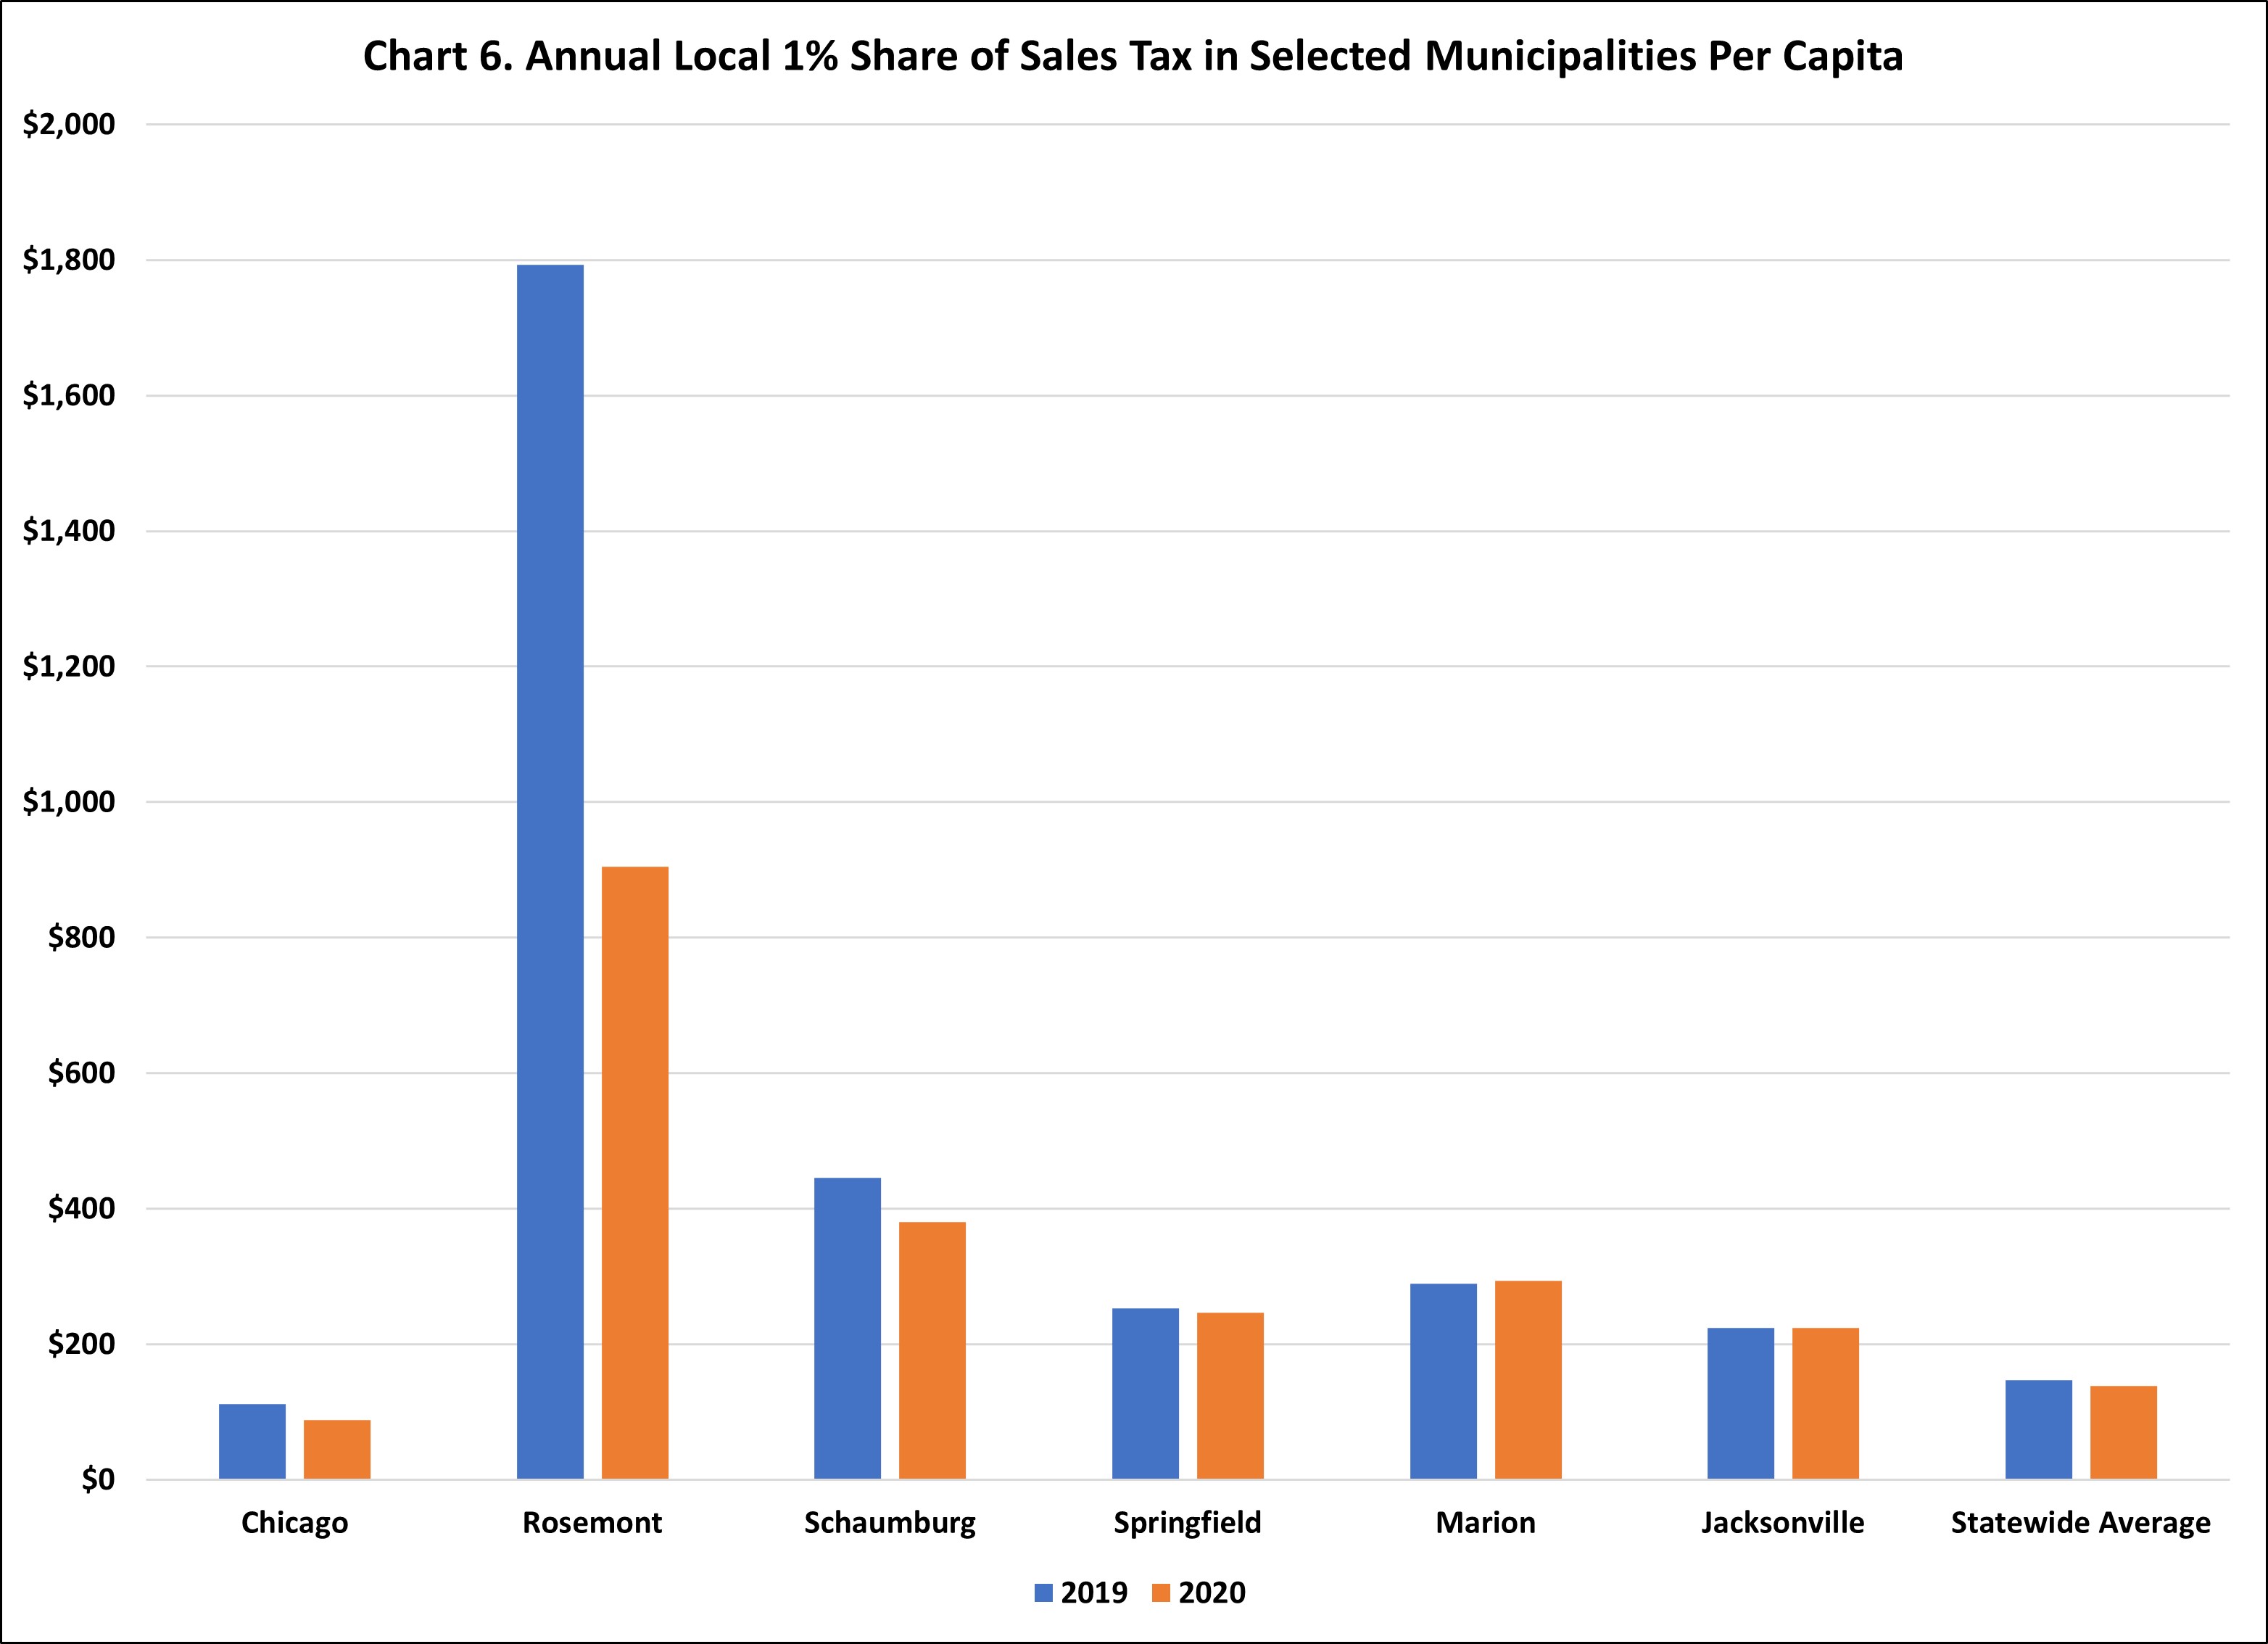
Besides imposing varying tax rates, cities vary in who actually pays the tax they impose. Those with large numbers of visitors – be they tourists or businesspersons or shoppers from a neighboring community – can “export” their taxes off their residents. Chart 6 shows the amount of Municipal Retailers’ Occupation Tax (MROT – the 1 percent tax rate imposed on all taxable sales) per capita collected in six selected cities. Strikingly, Chicago – with its tourist and business travelers – sits below that state average. The assumption is that Chicagoans avoid the higher sales taxes in the city by purchasing outside the city when possible, depressing the city’s taxable retail sales. Ironically, there are 48 cities in Illinois with higher home rule sales taxes than Chicago, but the total tax rate in the city gets boosted by Cook County Home Rule and RTA sales taxes.
While cities historically benefitted from being able to raise revenues from non-residents, the pandemic upset those patterns and cities reliant on tourism or business travel saw far greater hits to sales tax revenue. Chart 7 shows the percentage change from the same month the previous year in the 1 percent Municipal ROT that is part of the state’s basic 6.25 percent sales tax rate everywhere and includes food and drugs.
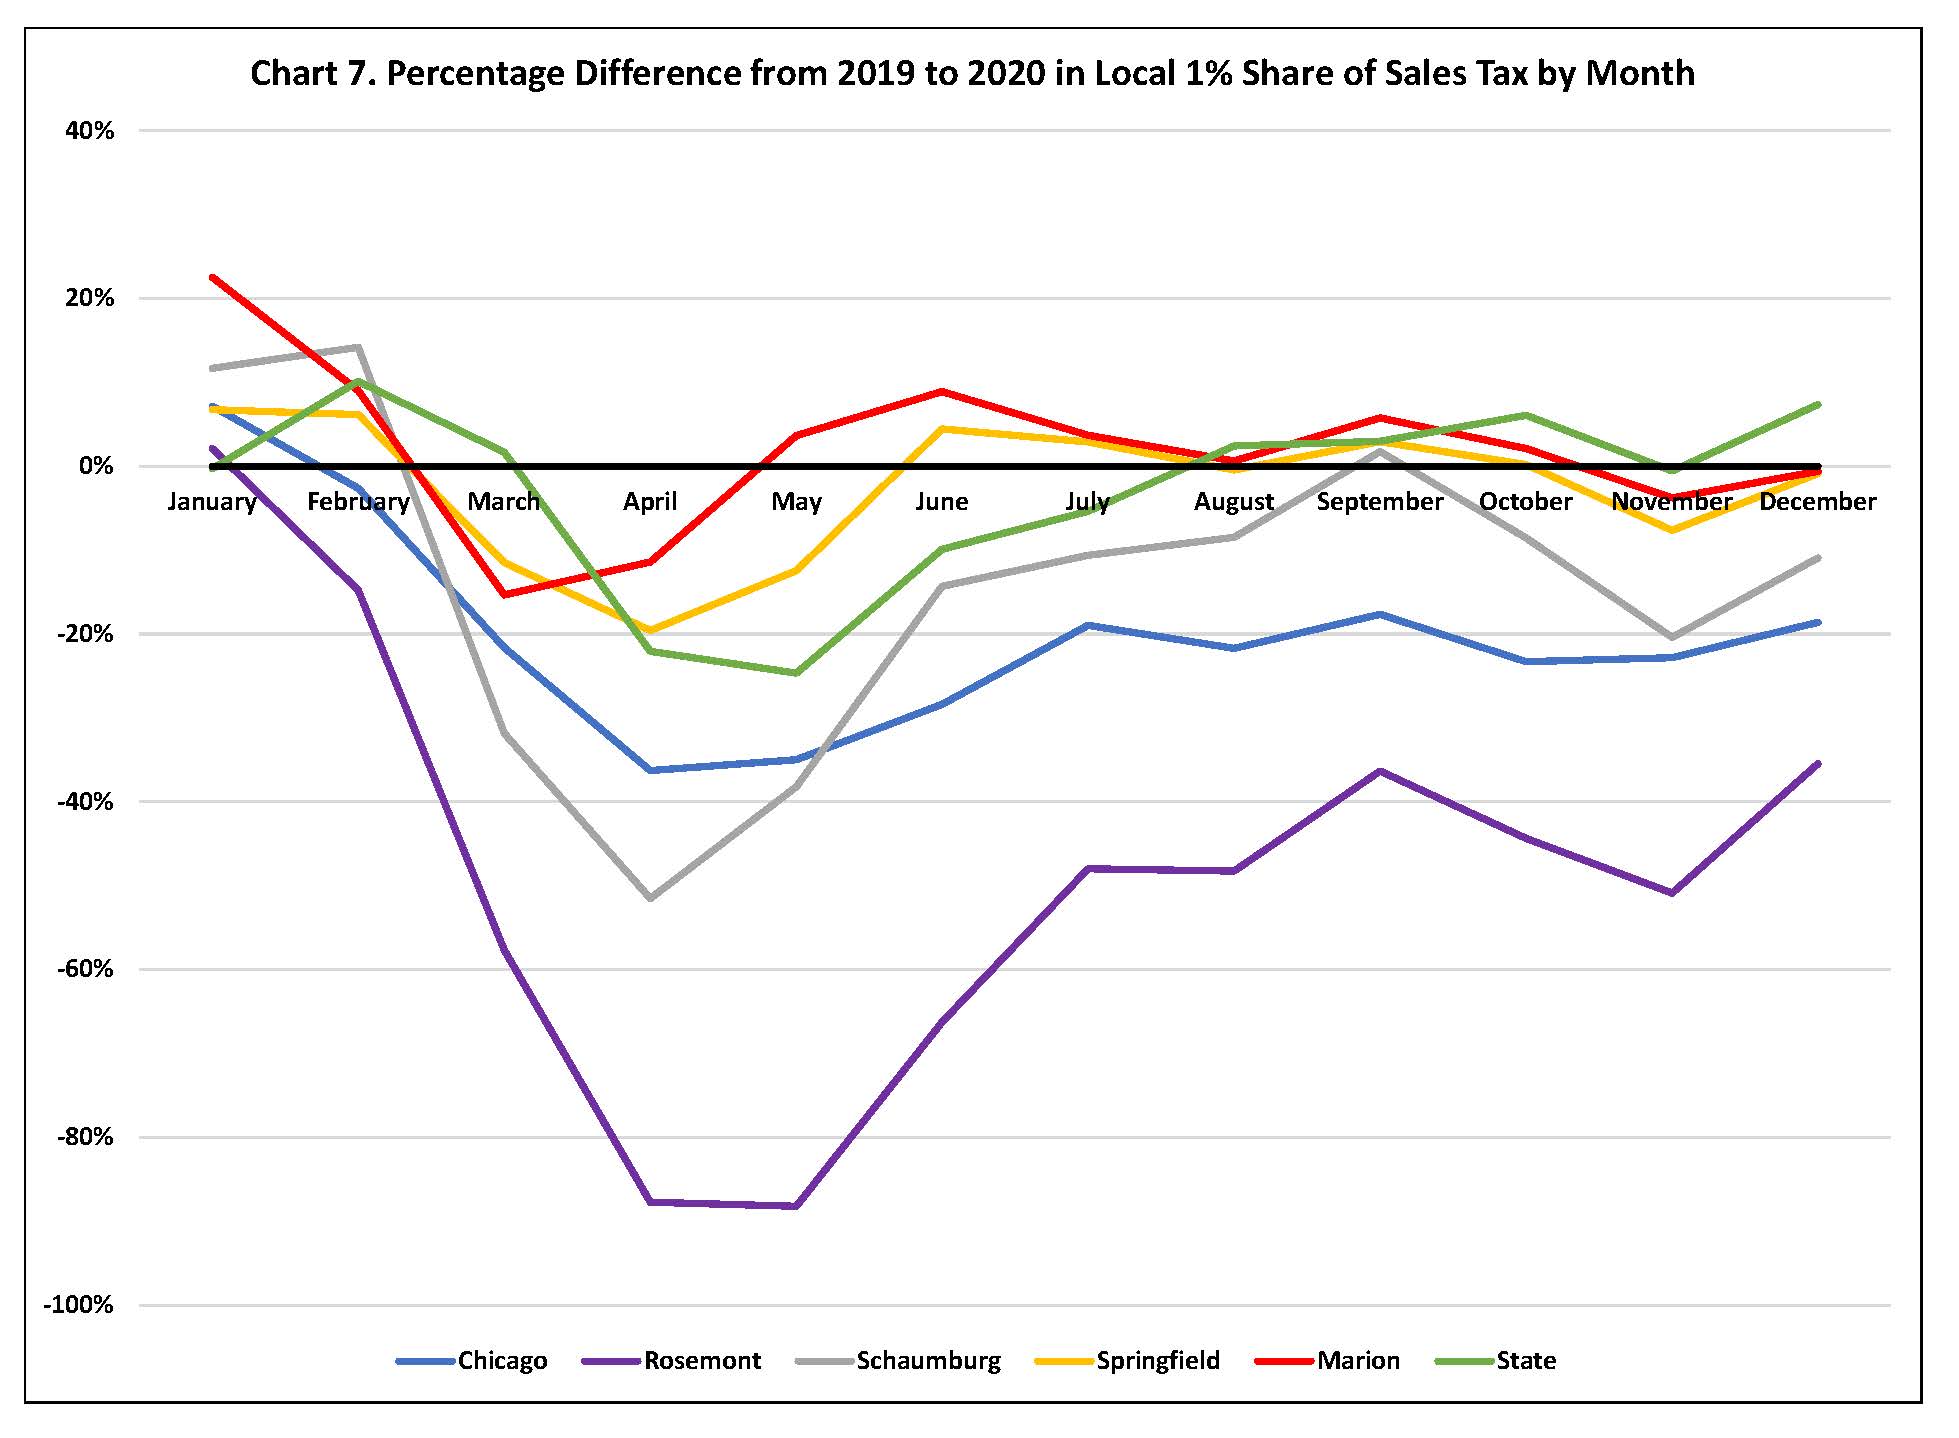
Receipts declined in cities across Illinois when the pandemic struck, as illustrated by the statewide line total (the green line) on Chart 7, but after hitting a low point in May, climbed upward to be positive by December. While all cities followed this pattern, generally, there are significant differences in magnitude. Rosemont with its proximity to O’Hare Airport and a host of entertainment and dining venues was the hardest hit city we looked at. Chicago with its tourism and convention business curtailed, was also hard hit. In these month-over-month comparisons, Springfield suffered financial losses when the General Assembly and accompanying lobbyists were gone in the spring. Schaumburg with its malls and shopping recovered by September, only to decline again. Meanwhile in southern Illinois Marion recovered quickly, then stagnated. Without the impact of COVID, we would have expected cities to be seeing increased receipts between 3 and 4 percent.
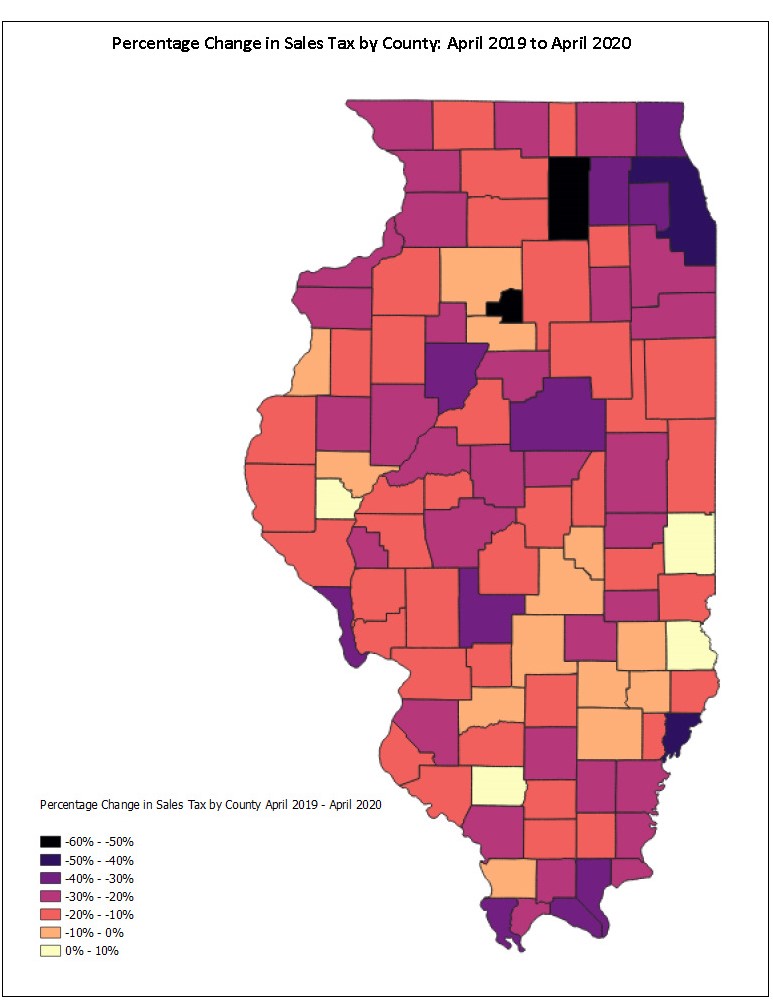
Looking from a broader geographic perspective, the map below shows the initial hit from the COVID pandemic by county, the percentage drop from April 2019 to April 2020 in County Supplementary Tax receipts (CST is the 0.25 percent tax that is part of the state’s 6.25 percent rate imposed on general merchandise and returned to county governments.) On the map, the darker the color the greater the loss.
Looking at High Rate and Low Rate Sales
We can take an even closer look at changes since COVID struck by examining sales data (the amount to which the tax rate is applied) from the ST-1 Sales and Use Tax Return, broken down by SIC Code, provided by the Department of Revenue. We have sales from:
- locations in Illinois (Retailers Occupation Tax) taxed at the high rate (6.25 percent plus locally imposed taxes) and taxed at the low rate (1 percent plus RTA’s 1.25 percent in Cook and 0.75 percent in the Collar Counties), and
- locations outside Illinois (Use Tax) taxed at the high rate of 6.25 percent and the low rate of 1 percent.
The totals for both ROT and Use Tax for high rate sales and low rate sales are shown in Chart 8 for each month in the last two years. For high-rate sales the crash is obvious and it is evident that the monthly numbers have reset below the pre-COVID levels. (Ignore December which spikes each year when annual filers report). Low-rate sales has remained stable pre- and post-COVID, as Illinoisans have continued to buy groceries and medicines. The March 2020 spike in low-rate sales is discernible on the chart, recalling the empty store shelves.
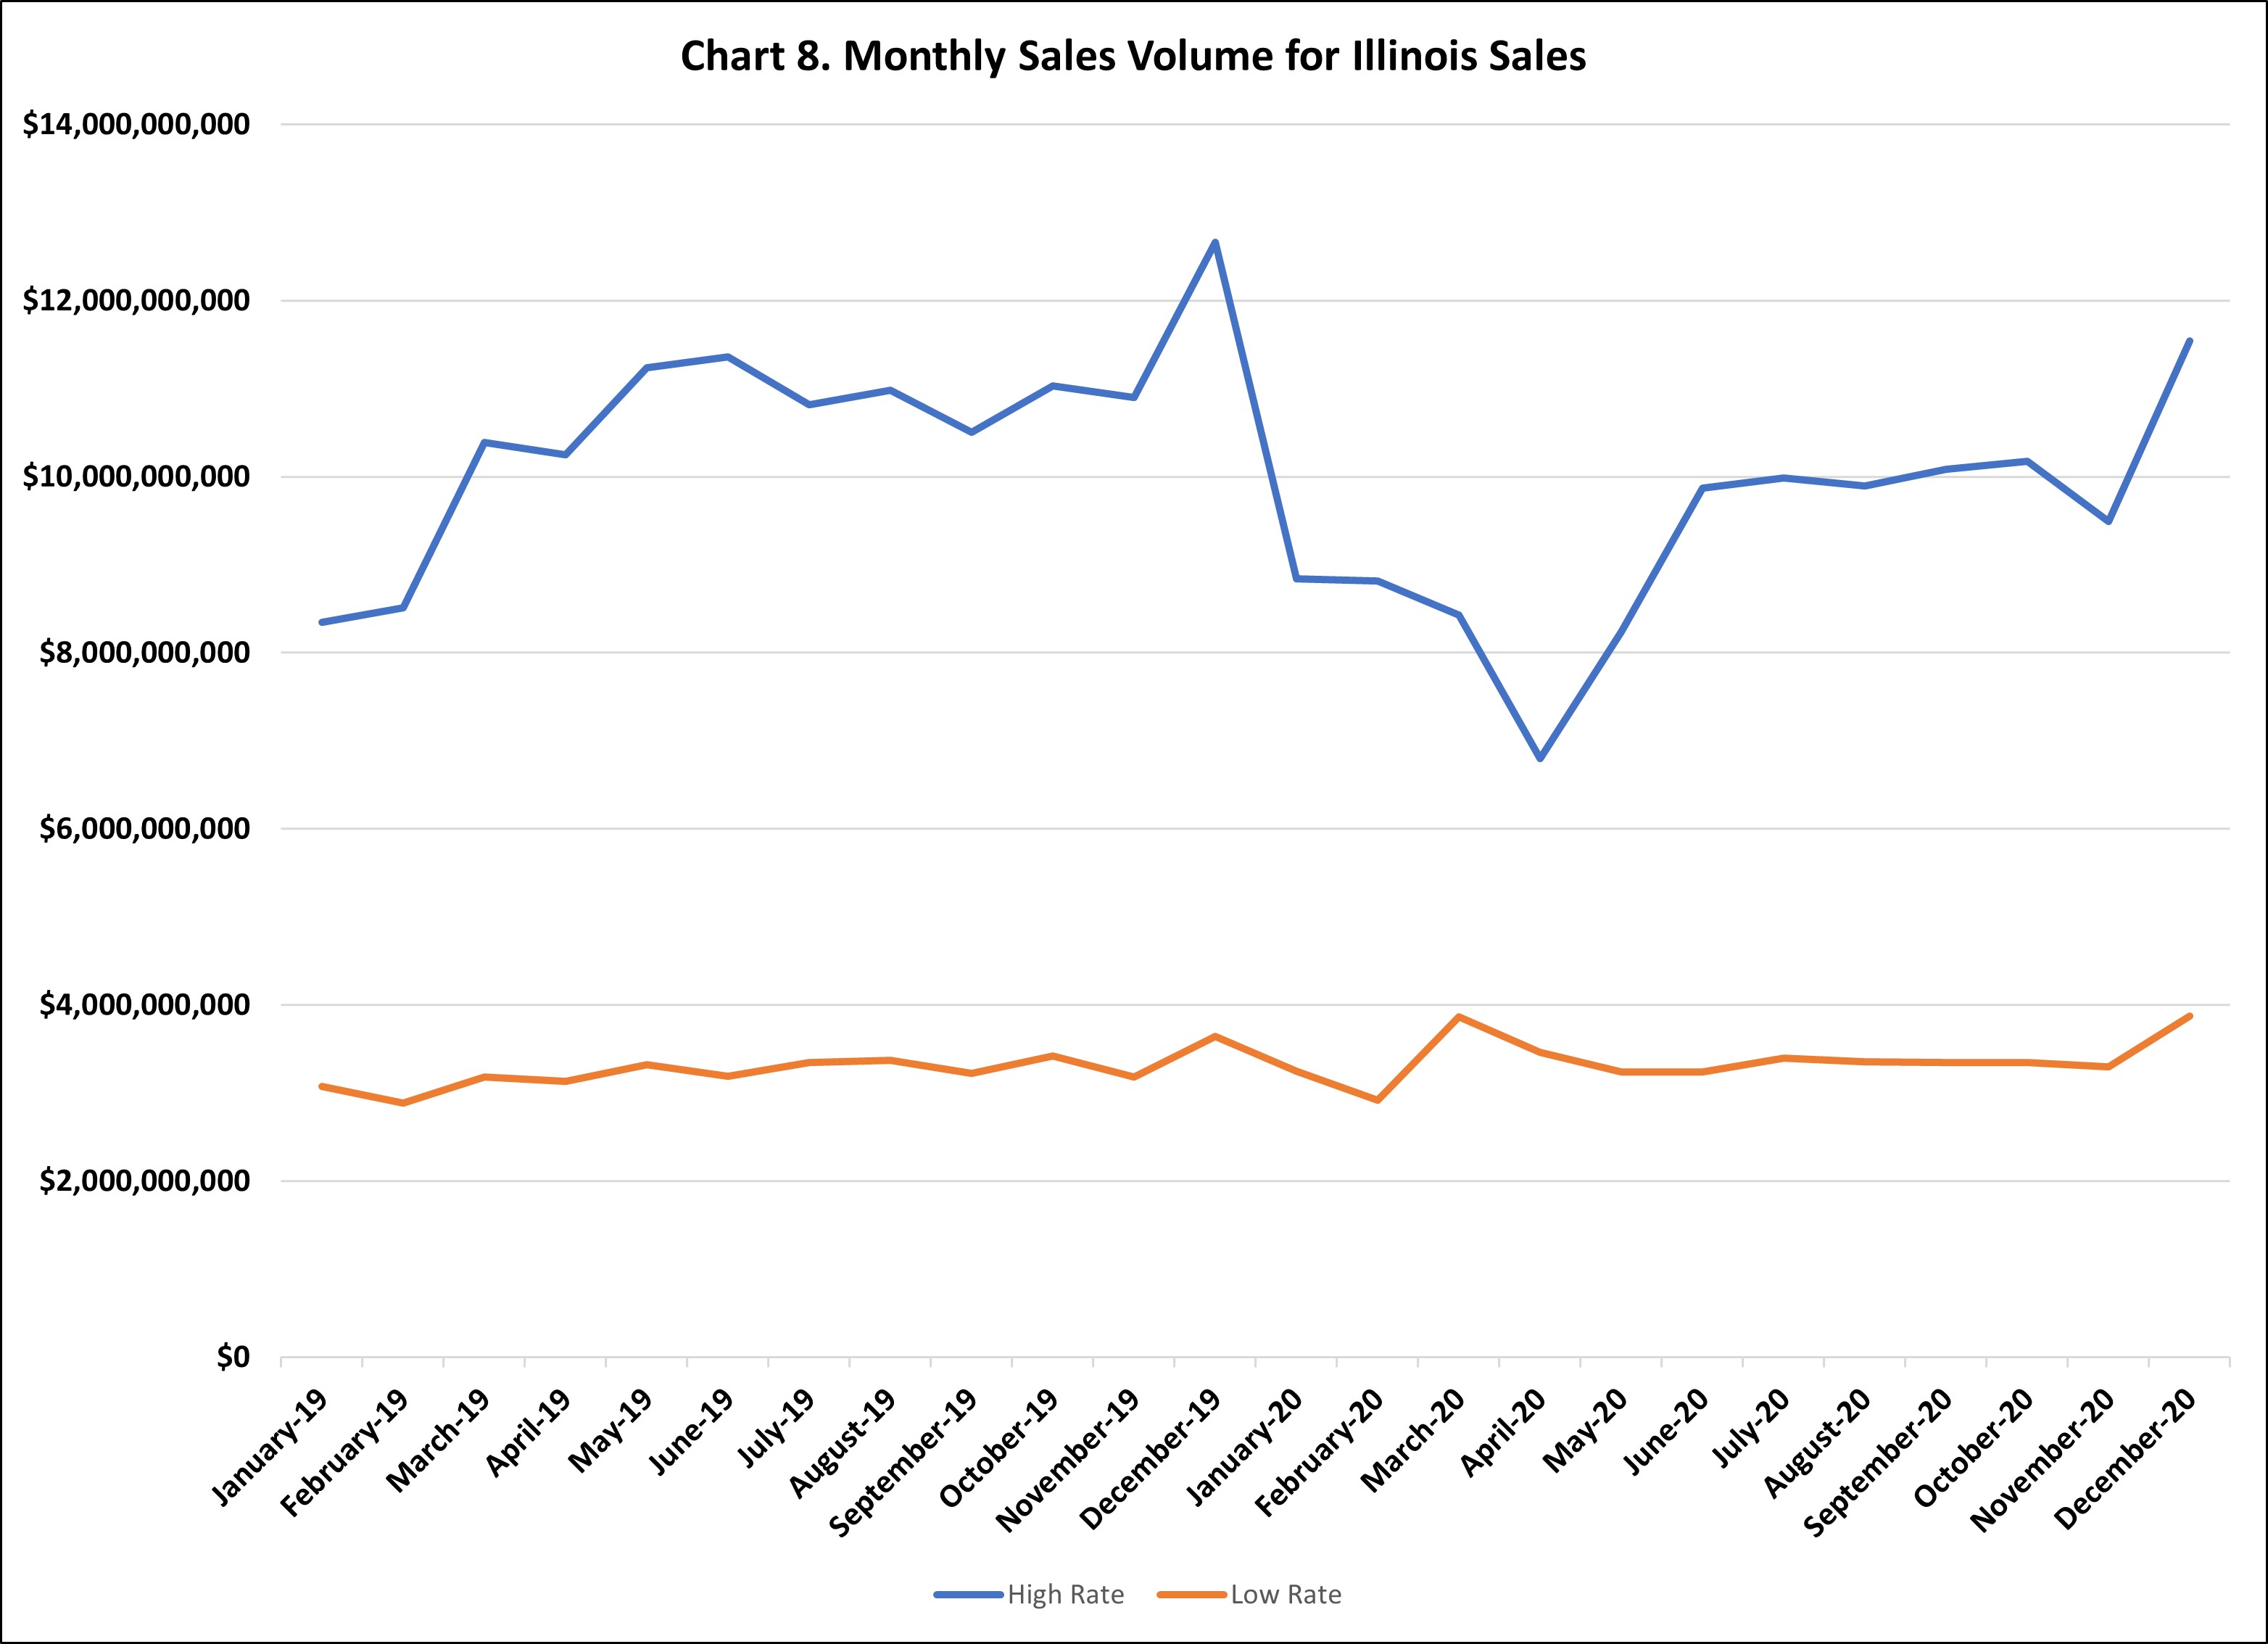
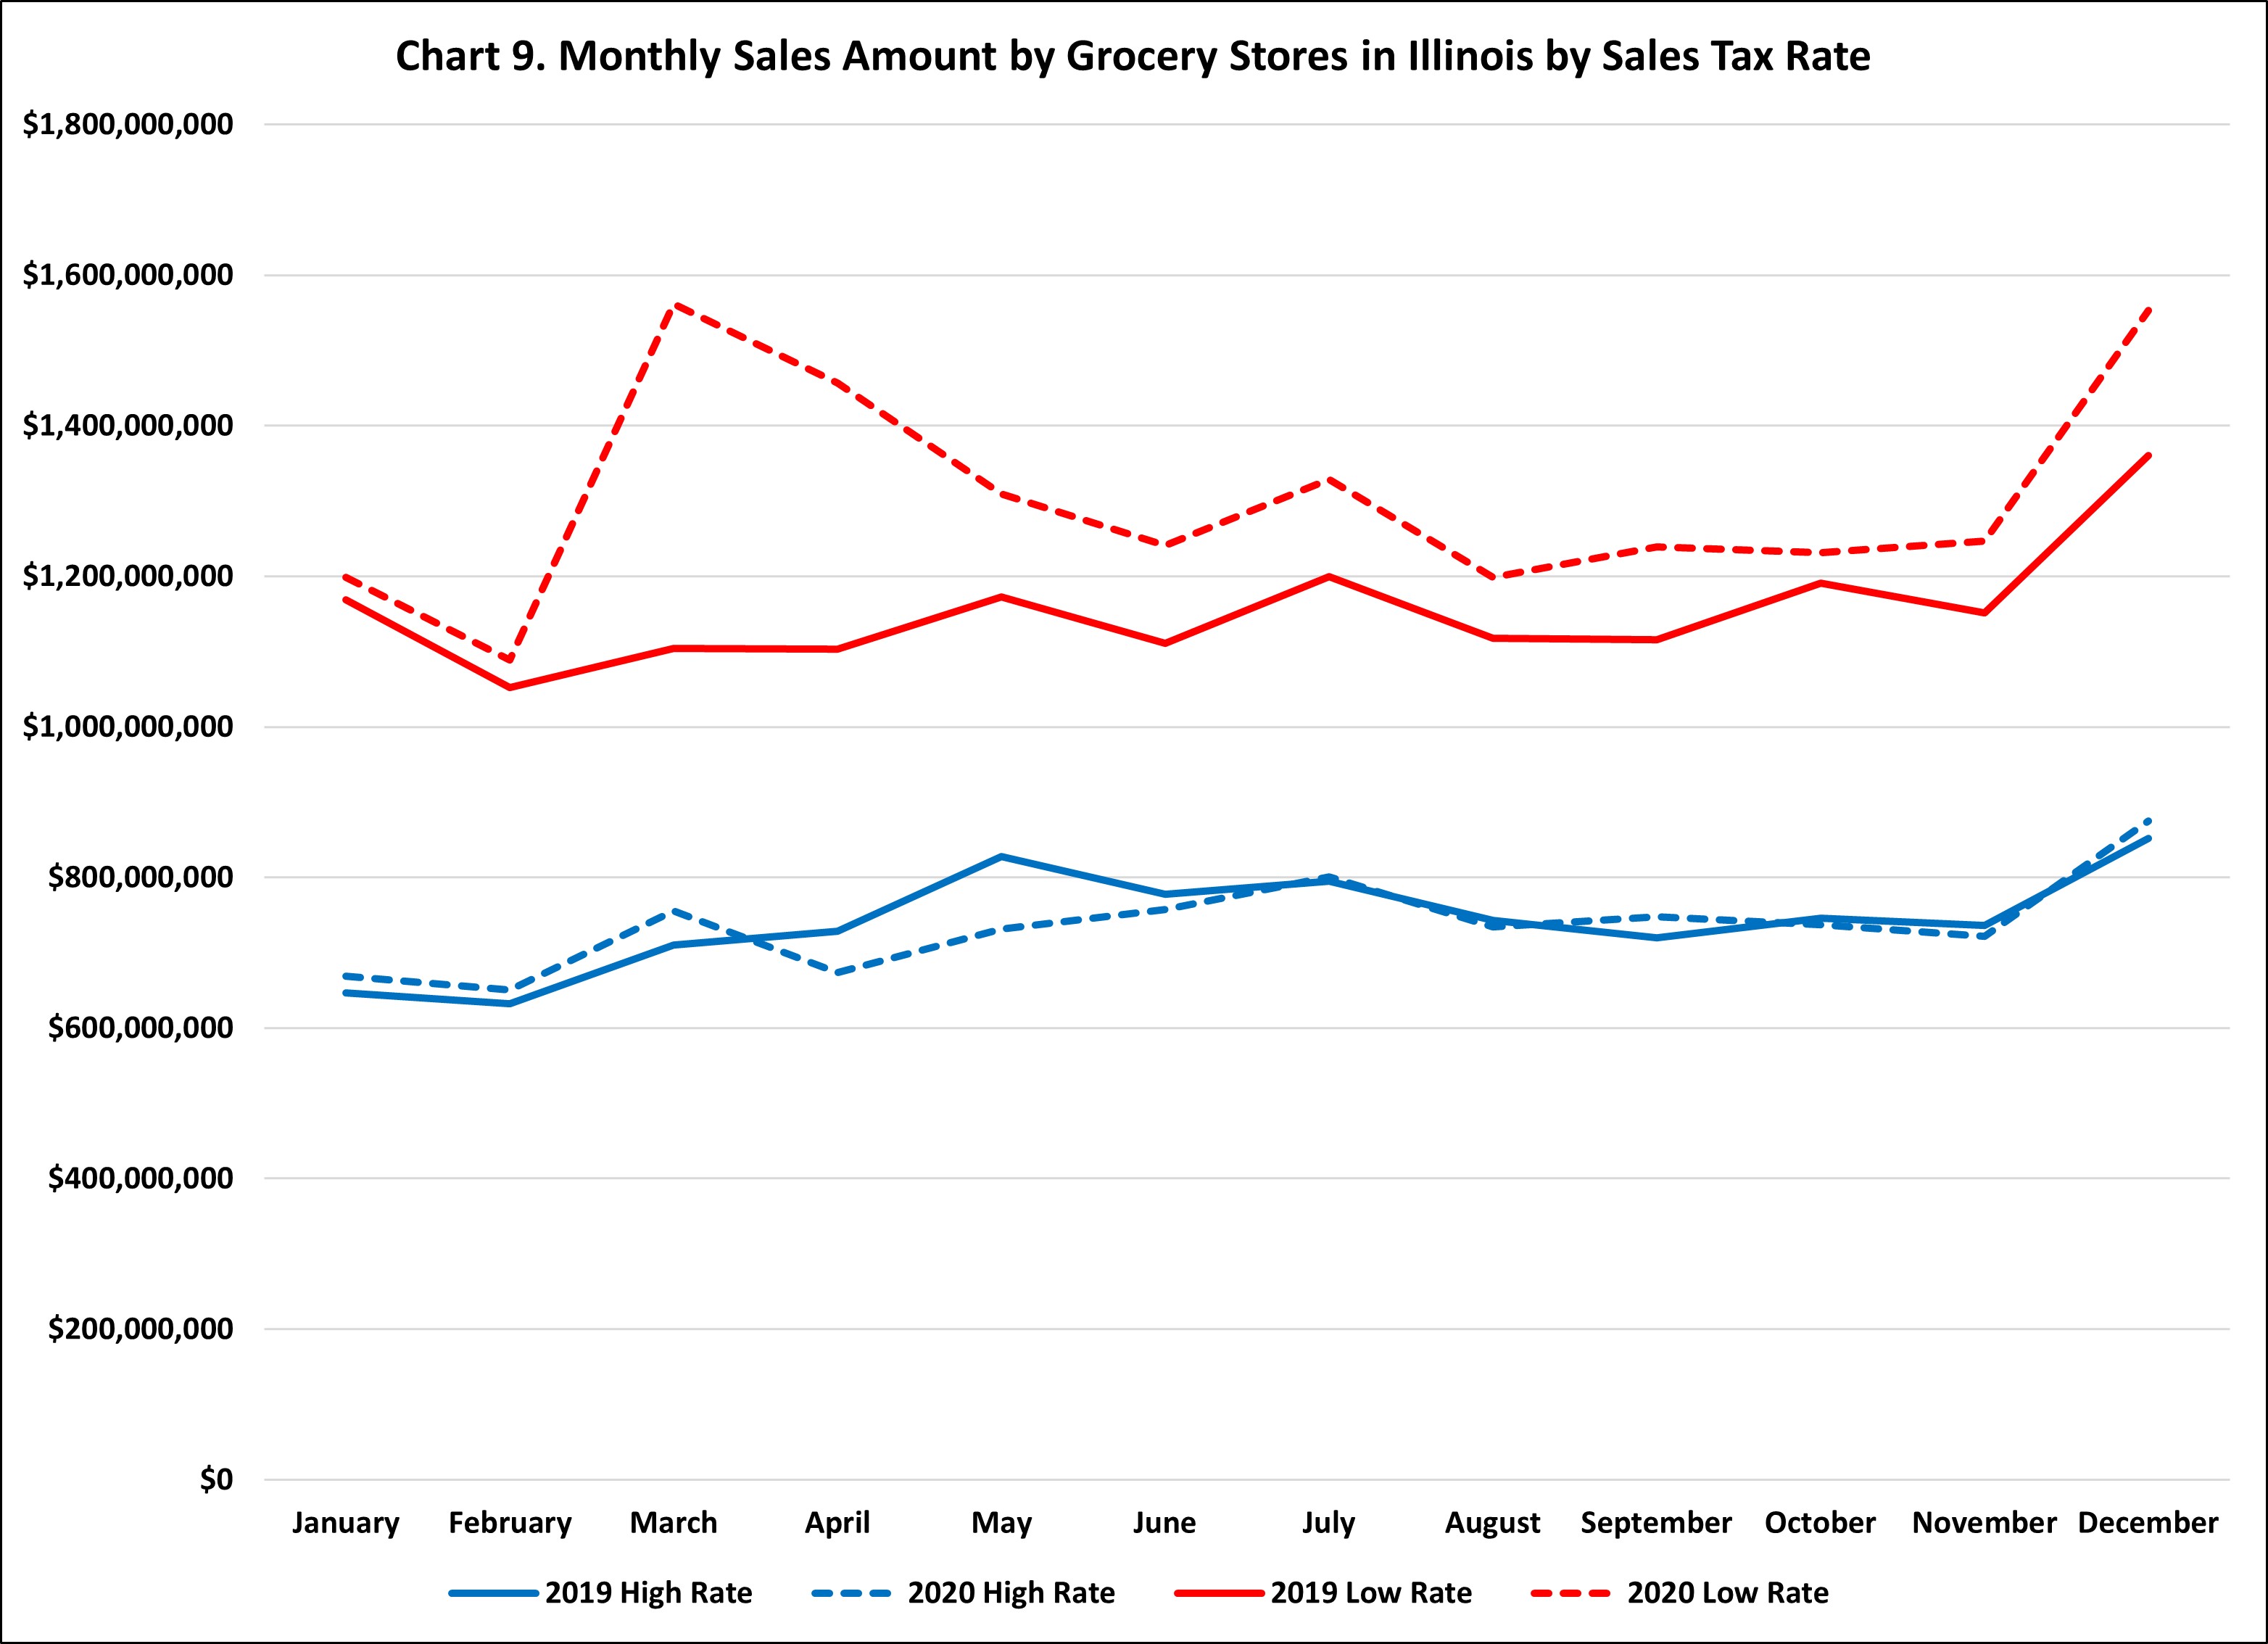
Chart 9 looks only at grocery store sales, and changes are more stark. It reminds us that although grocery store sales are primarily of low-rate items, tax collections are primarily high rate, because of the difference in tax rates. The chart shows the March spike in grocery sales, and then settles in at a higher level than before COVID. On the other hand, high-rate non-food items sold by grocery stores have remained relatively stable throughout.
Conclusions
What we call sales tax in Illinois is a collection of occupation taxes and use taxes. Sales taxes are also highly localized, given Illinois’ historic inclination to allow local governments to impose sales taxes administered by the Department of Revenue.
Illinois state government sales tax receipts took an initial hit when COVID arrived in Illinois in March of 2020. Retailer’s Occupation Taxes paid on purchases in Illinois stores were down, but as residents turned to online purchases, Use Tax collections were up. Overall, Illinois’ FY 2021 sales tax (occupation plus use taxes) will exceed the pre-pandemic estimates.
By sectors, restaurants and bars saw a significant decline in collections, while liquor stores and building supply retailers saw an increase. Grocery stores saw the sales of food increase, but at the low rate of taxation.
The effect on local governments varied widely. Those reliant on taxes paid by visitors – be they tourists or businesspeople – saw significant reductions in sales tax receipts because there is no Use Tax associated with locally imposed sales taxes.
*Maurice Scholten is the Legislative Director of the Taxpayers’ Federation of Illinois. Mike Klemens does tax policy research for TFI.