The State Pension Systems: Ten Years After Tier II
The State Pension Systems: Ten Years After Tier II
October 2022 (75.7)
In the Spring of 2010, the General Assembly passed P.A. 96-0889 which has become known as “Tier II.” It created a new lower level of pension benefits for future employees of the state and local governments in Illinois, excluding local police and firefighters.1 The General Assembly created this lower level of pension benefits in an effort to lower the State’s pension payments. These lower pension benefits applied to employees that started working for the government on or after January 1, 2011. Now that more than ten years have passed since Tier II went into effect, we thought it was a good time to look at the data (from the pension systems actuarial valuations and the annual reports published by COGFA) and see what Tier II has accomplished, and what it hasn’t.
Tier I vs Tier II
There is no doubt that Tier II benefits are inferior to Tier I benefits. The major differences are as follows:
- Tier II has a pensionable salary cap that was initially $106,800 and is increased each year by half of CPI. In 2022, that cap is $119,892. An employee can earn more than the pensionable salary cap, but when calculating their annuity, their salary used for the annuity calculation cannot exceed the pensionable salary cap. Tier I has no comparable pensionable salary cap.
- When calculating a Tier II retiree’s final average salary to determine the annuity, the calculation uses the eight highest years of compensation rather than the four highest years for Tier I.
- A Tier II retiree’s annuity will be increased by half of CPI each year (with a maximum of 3% per year) calculated using their initial annuity amount. This means the annual increase is not compounded each year and is less than Tier I’s 3% annual compounded increase.
- The regular retirement age was increased to 67 years of age. Tier I’s retirement age varied by system and years of service, but at most was 62 years of age and as low as 55 years of age.
Every change listed here either (i) causes an annuity to be lower, (ii) delays when an employee can start receiving their annuity, or (iii) reduces increases to the annuity after retirement. The General Assembly also created “Tier III” benefits for the major state pension systems, but the systems have not implemented the new plan. Tier III has a smaller defined benefit than Tier II but it also includes a defined contribution portion.
Status of the Pension Systems
A lot has happened since Tier II was created in 2010. In 2013, the State passed SB1 (P.A. 98-0599) which reduced pension benefits for current employees and retirees; the bill was ultimately ruled unconstitutional by the Illinois Supreme Court and did not go into effect.2 The assumed rates of return of the pension systems’ investments have been reduced from a range of 7% – 8.5% to a range of 6.5% – 7%. The State has enacted optional pension buyouts for retirees. Last but not least, the pension systems have changed their actuarial assumptions. All of these changes have had an impact on the finances of the pension systems. And it goes without saying that the economy has a direct effect on investment returns of the pension systems.
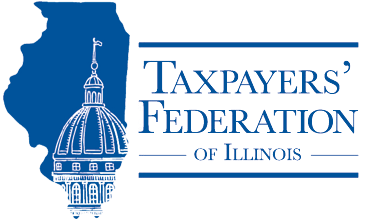
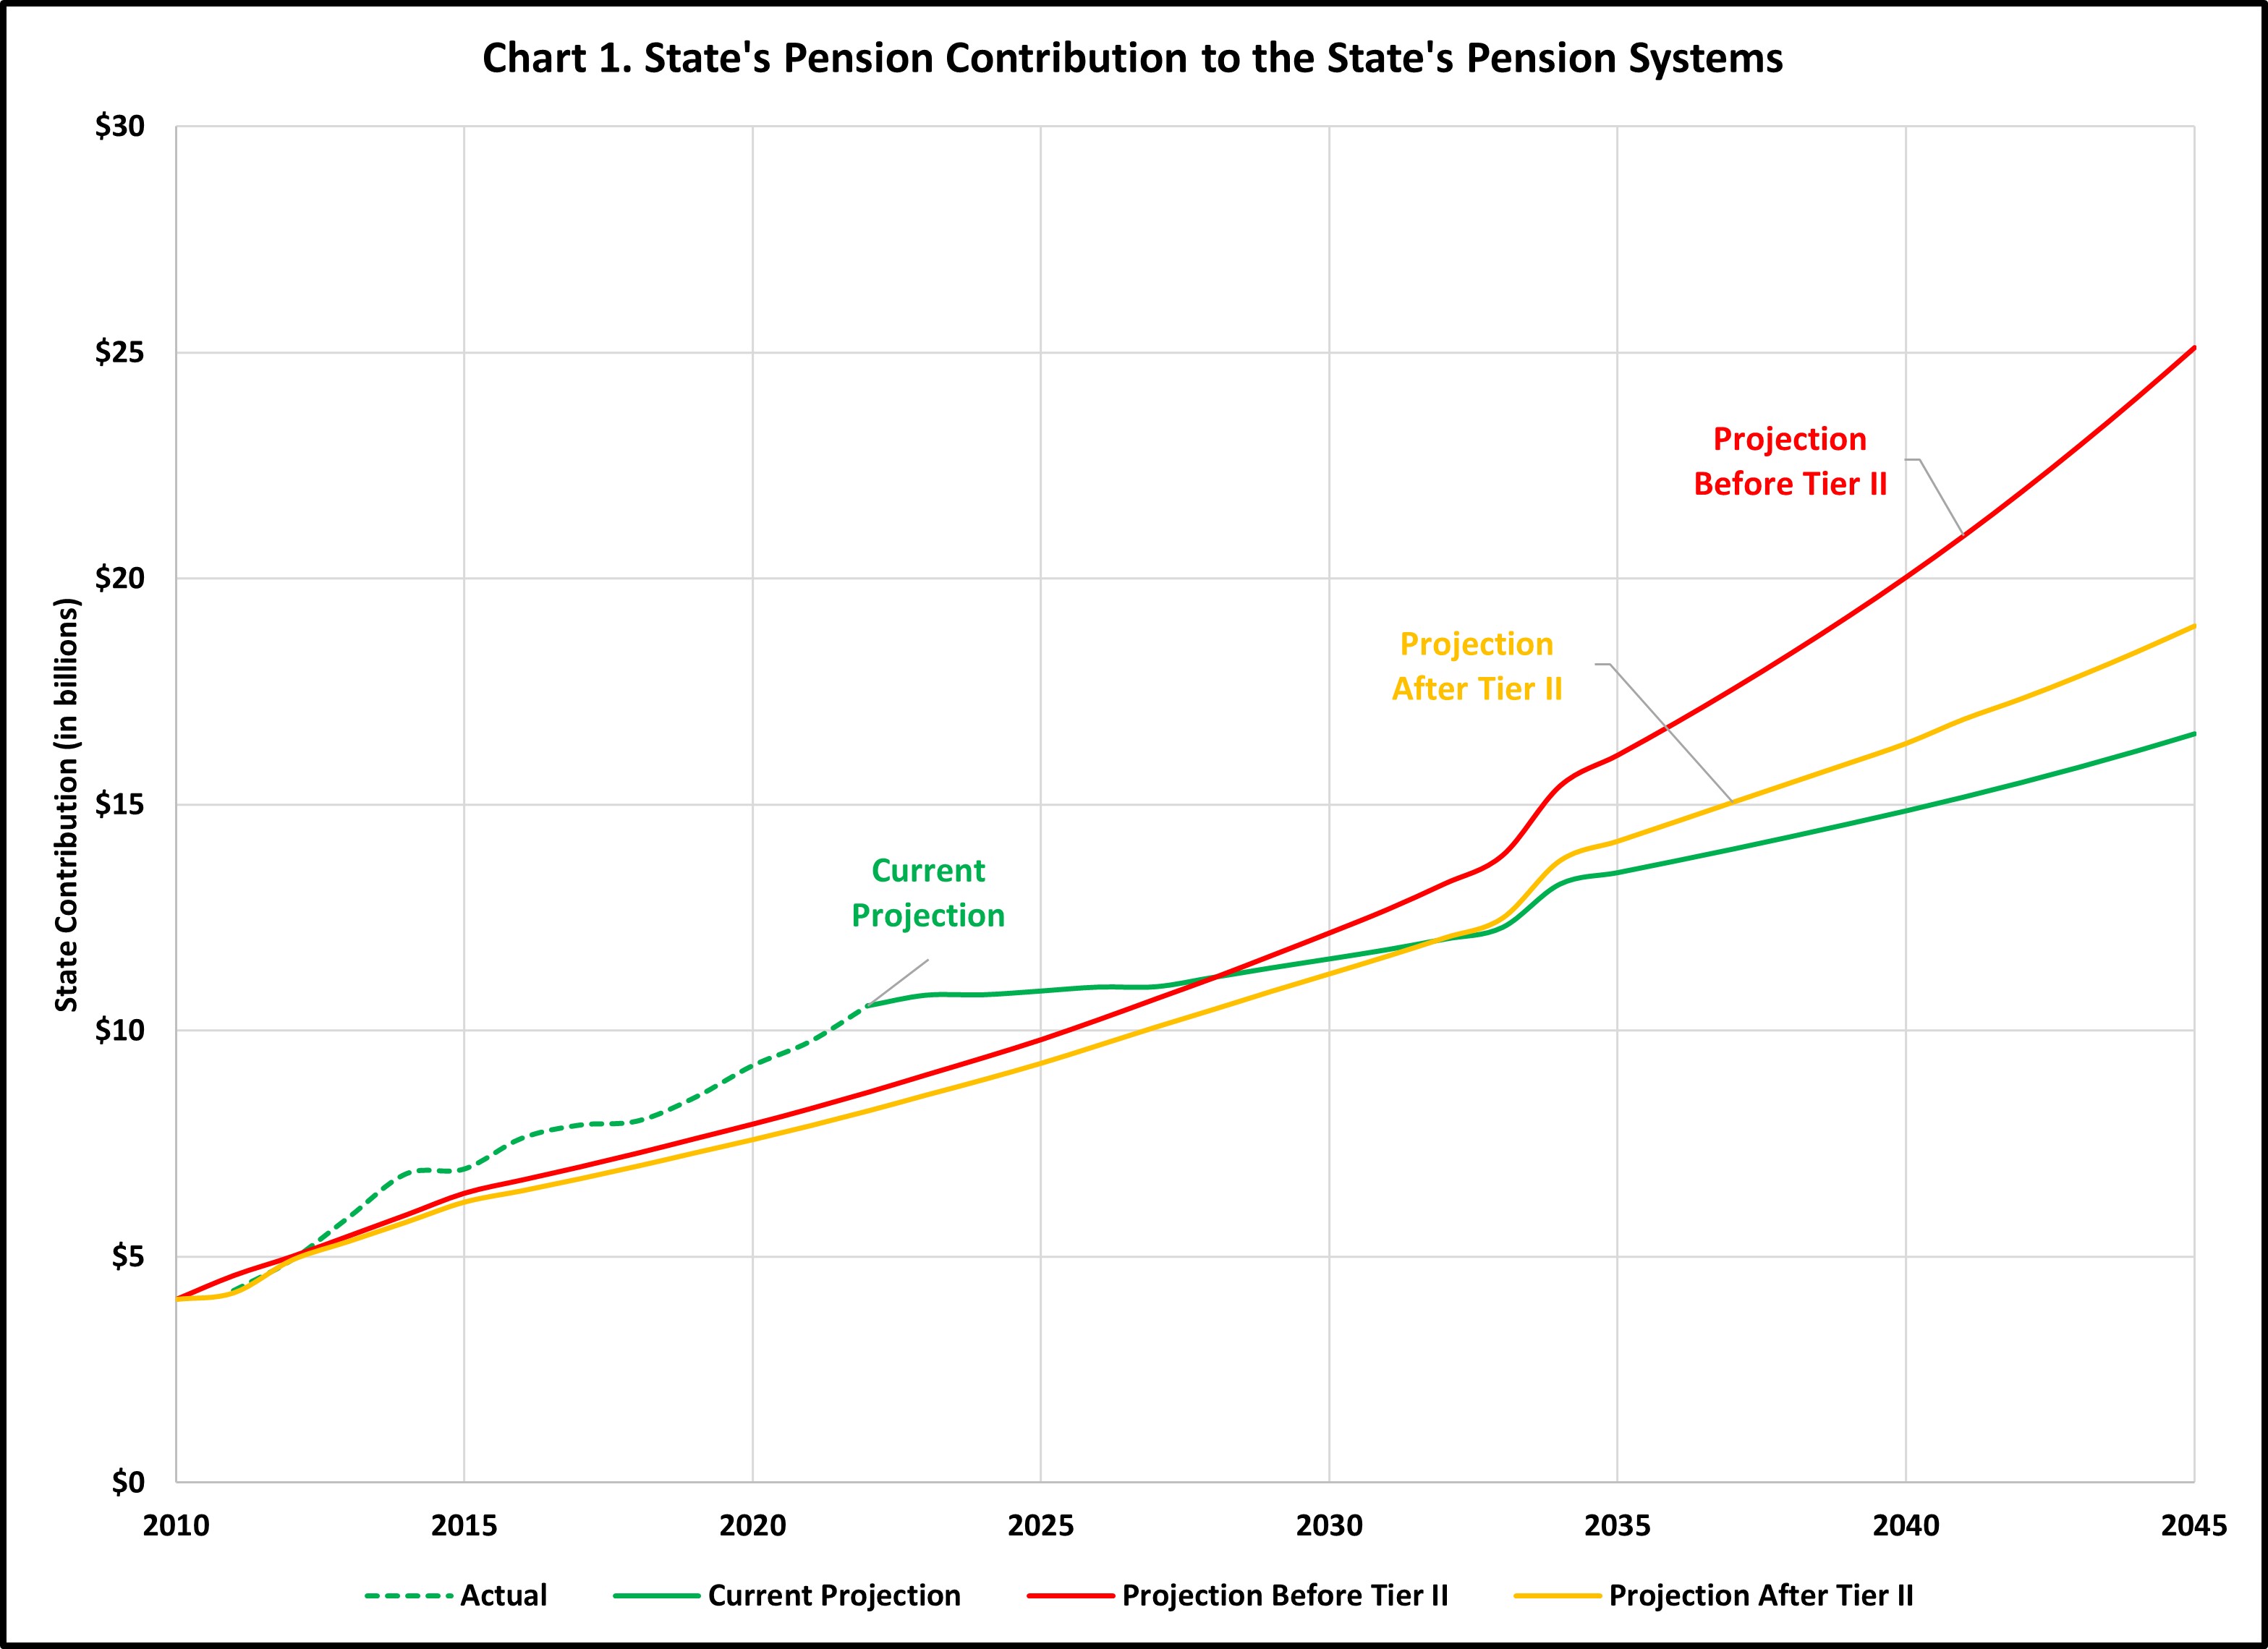
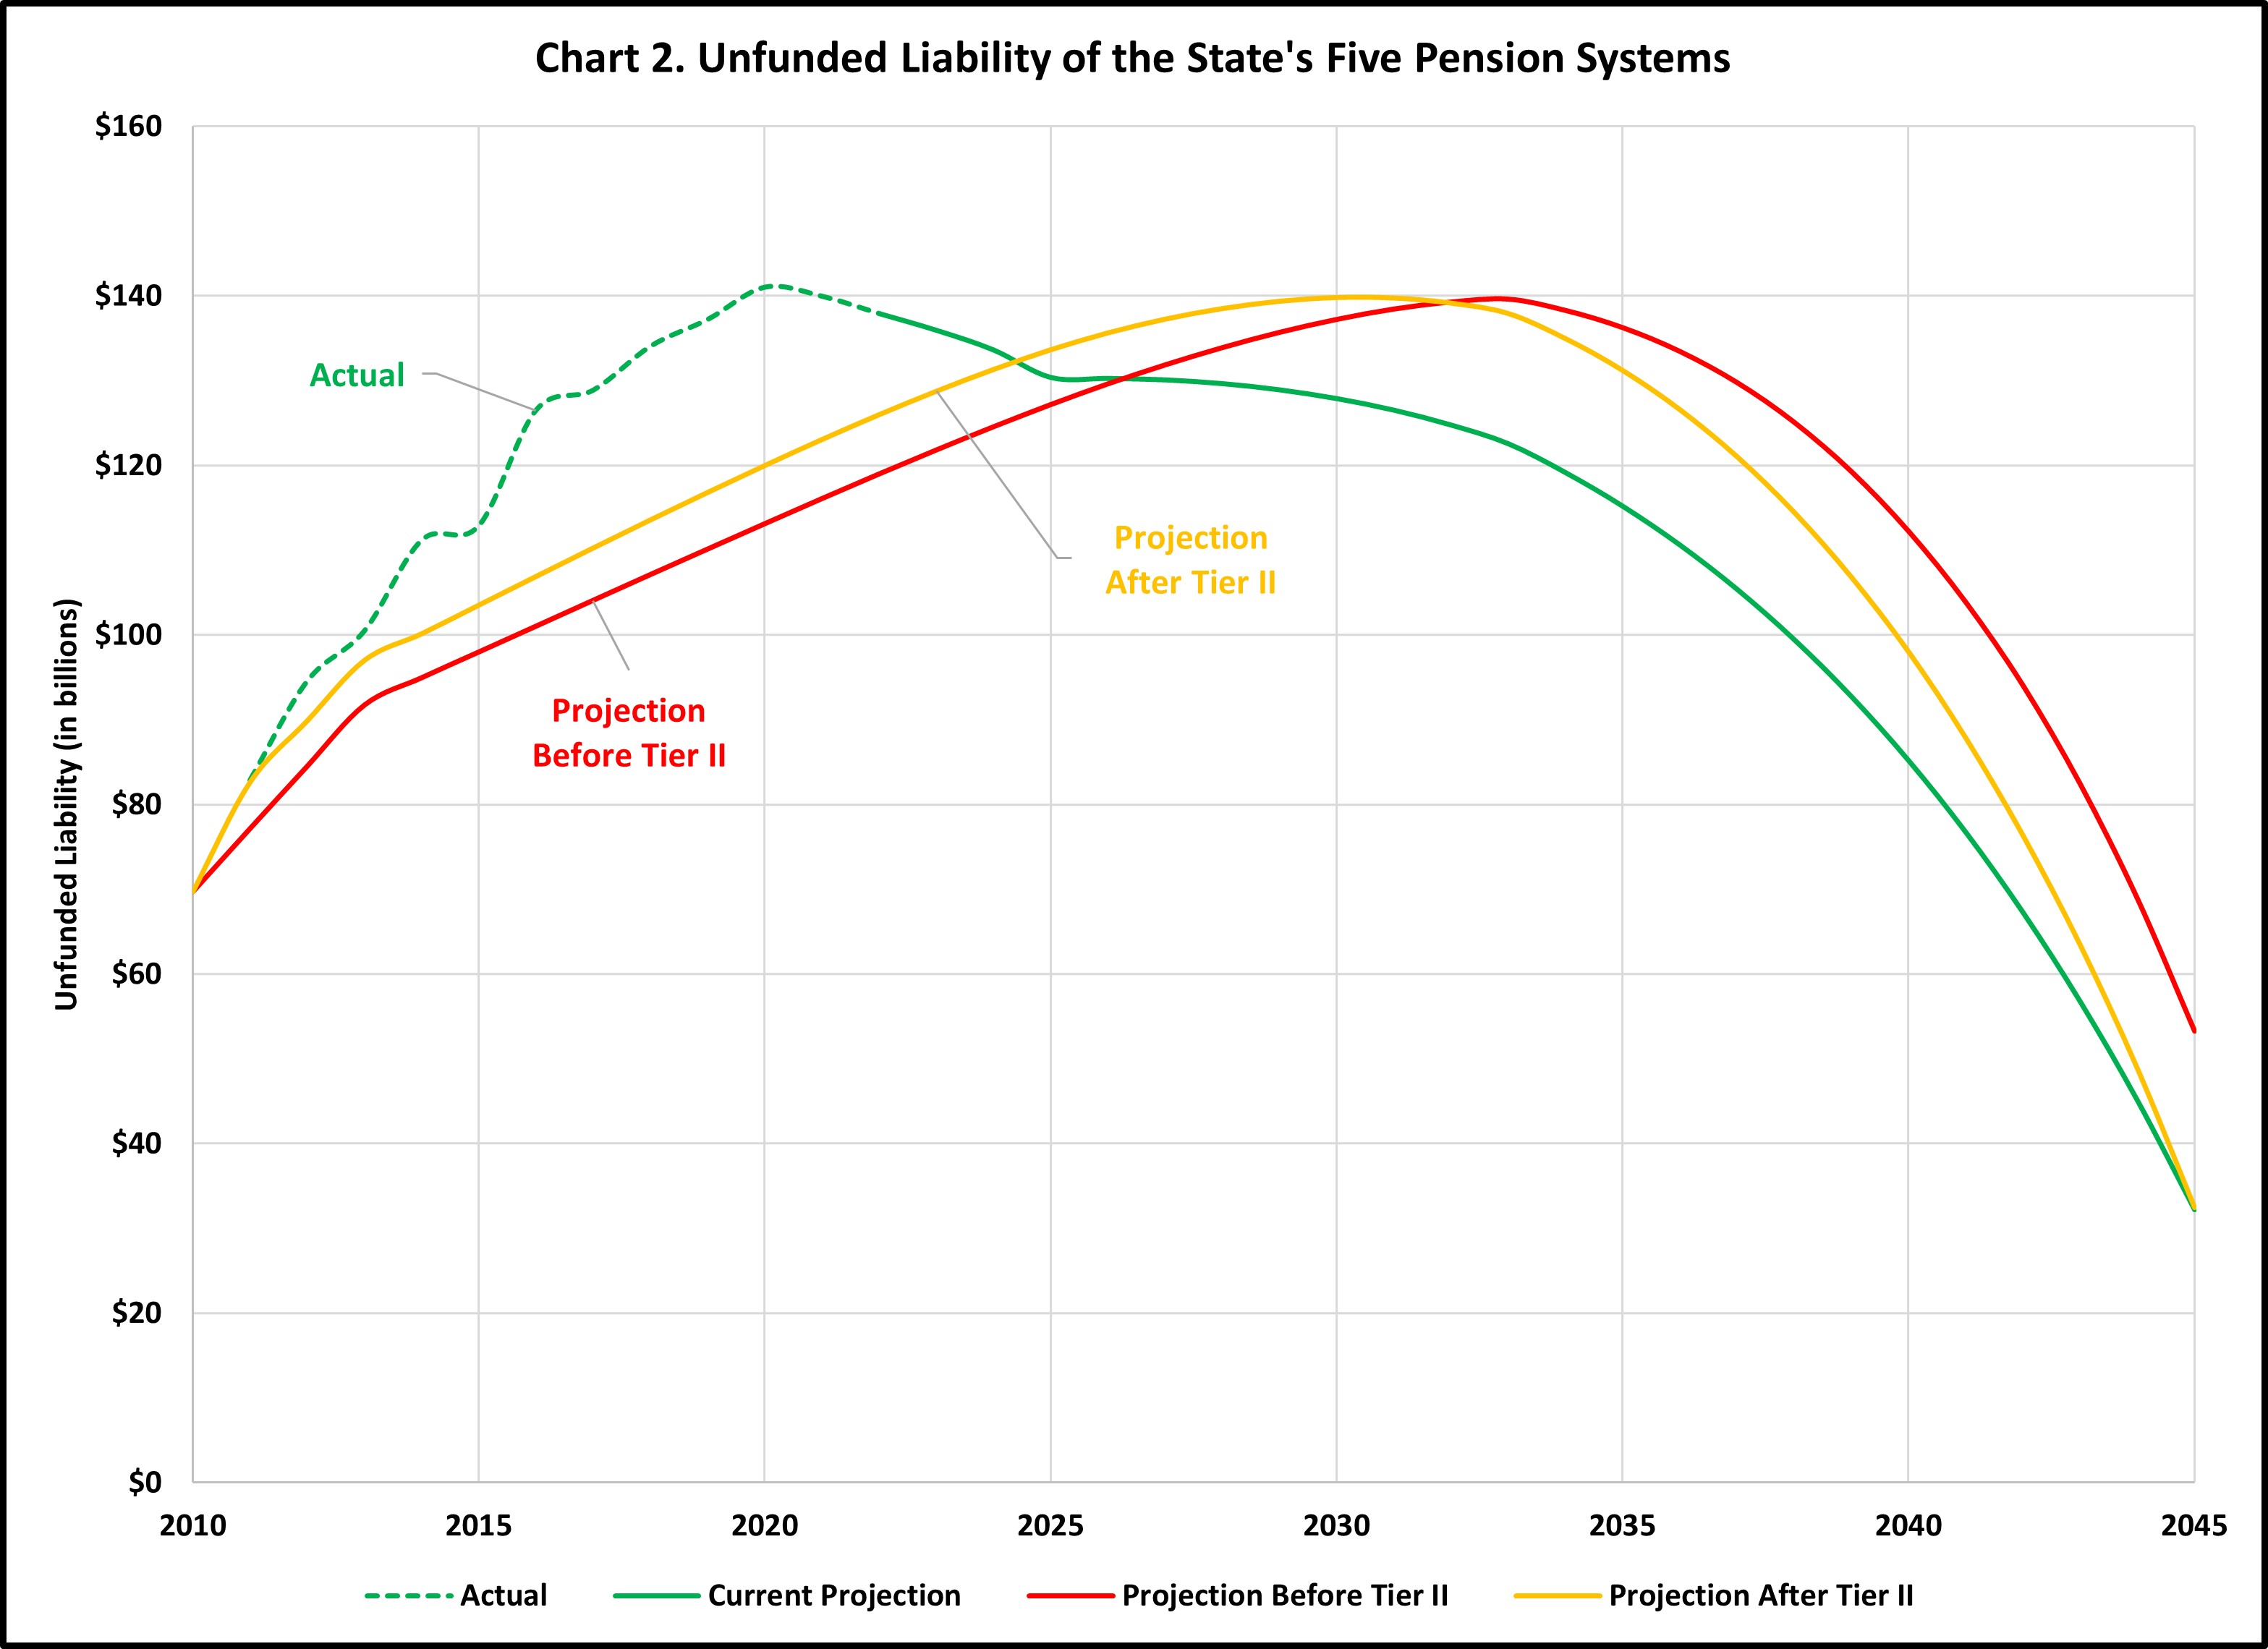
Below are a series of charts that show various measures of the State’s five pension systems (TRS, SURS, SERS, JRS, & GARS). Each chart has three lines: a red line which shows the projections for the pension systems as of 2009 (prior to the passage of Tier II); a yellow line which shows the projections as of 2010, (immediately after passage of Tier II); and then a green line which represents what actually happened and the most current projections.
Chart 1 shows the State’s projected annual pension contribution through 2045. Looking at FY2023, the State’s actual pension payment is almost 20% higher than it was projected to be prior to the passage of Tier II. This gives the impression that Tier II didn’t work because the State’s pension payments are higher than they were projected to be. Just looking at this, one may conclude the State would have been better off not passing Tier II. However, that is far from the truth.
If the State hadn’t passed Tier II, the current pension payments would be even higher than they currently are, as changes to the systems which have increased the total pension liability would have still happened. The pension system’s assumed rate of return would have still been reduced, and the reduction of these rates caused the State’s contributions to increase. The investment returns (and sometimes losses) would have been essentially the same. Actuarial assumptions would have still changed (including changes to the mortality table which reflects people living longer and receiving their pensions for a longer period of time). Even with these changes, the chart shows that in just a few years the State’s contributions are projected to be lower than they would have been without Tier II.
Chart 2 shows how the unfunded liability was projected to grow and how it has actually grown. The unfunded liability has grown faster than initially projected and is higher now that it was projected to be prior to the creation of Tier II. However, starting around 2027 the unfunded liability is anticipated to be lower than the original projection.
There is an unfunded liability because the pension systems do not currently have enough assets to cover the expected cost of the benefits. The unfunded liability is calculated by subtracting the assets of the pension systems from the actuarially accrued liability (the value of benefits earned). In other words, a change in either the value of assets or the expected cost of benefits changes the unfunded liability. What caused the higher than anticipated unfunded liability: are the value of the benefits earned more than originally estimated, or are the value of the pension assets less than anticipated?
Chart 3 answers that question, showing how accrued liabilities—the value of the benefits earned by members of the pension systems—has changed from original projections. The actual accrued liability is $29 billion higher than originally anticipated, but the unfunded liability is only $24 billion higher than anticipated. Conversely, the actuarial value of the assets of the pension systems is $5 billion more than originally estimated. (Using the market value of the assets, the systems have $15 billion more than anticipated.) In other words, the higher than anticipated unfunded liability is due to liabilities being higher than anticipated, rather than fewer assets than anticipated. Even though the value of the benefits is currently about $20 billion or 12% higher than originally anticipated, it is still projected to grow at a slower pace over time than before Tier II passed.
The actuarial liability of the systems grew by about $7 billion each year, but it grew by about $15 billion per year in 2012, 2014, and 2016. Below is a table showing the change in the pension system’s assumed rate of return going back to 2010. Over the last 10 years, the pension systems have slowly decreased their assumed rate of returns. After 2011, 2013, and 2015, TRS decreased their assumed rate of return by half a percentage point. These decreases correspond with the larger than anticipated increases in the actuarial liability the following year, as the pension systems were now expecting lower returns from investments and would need more funds in order to generate the same returns.
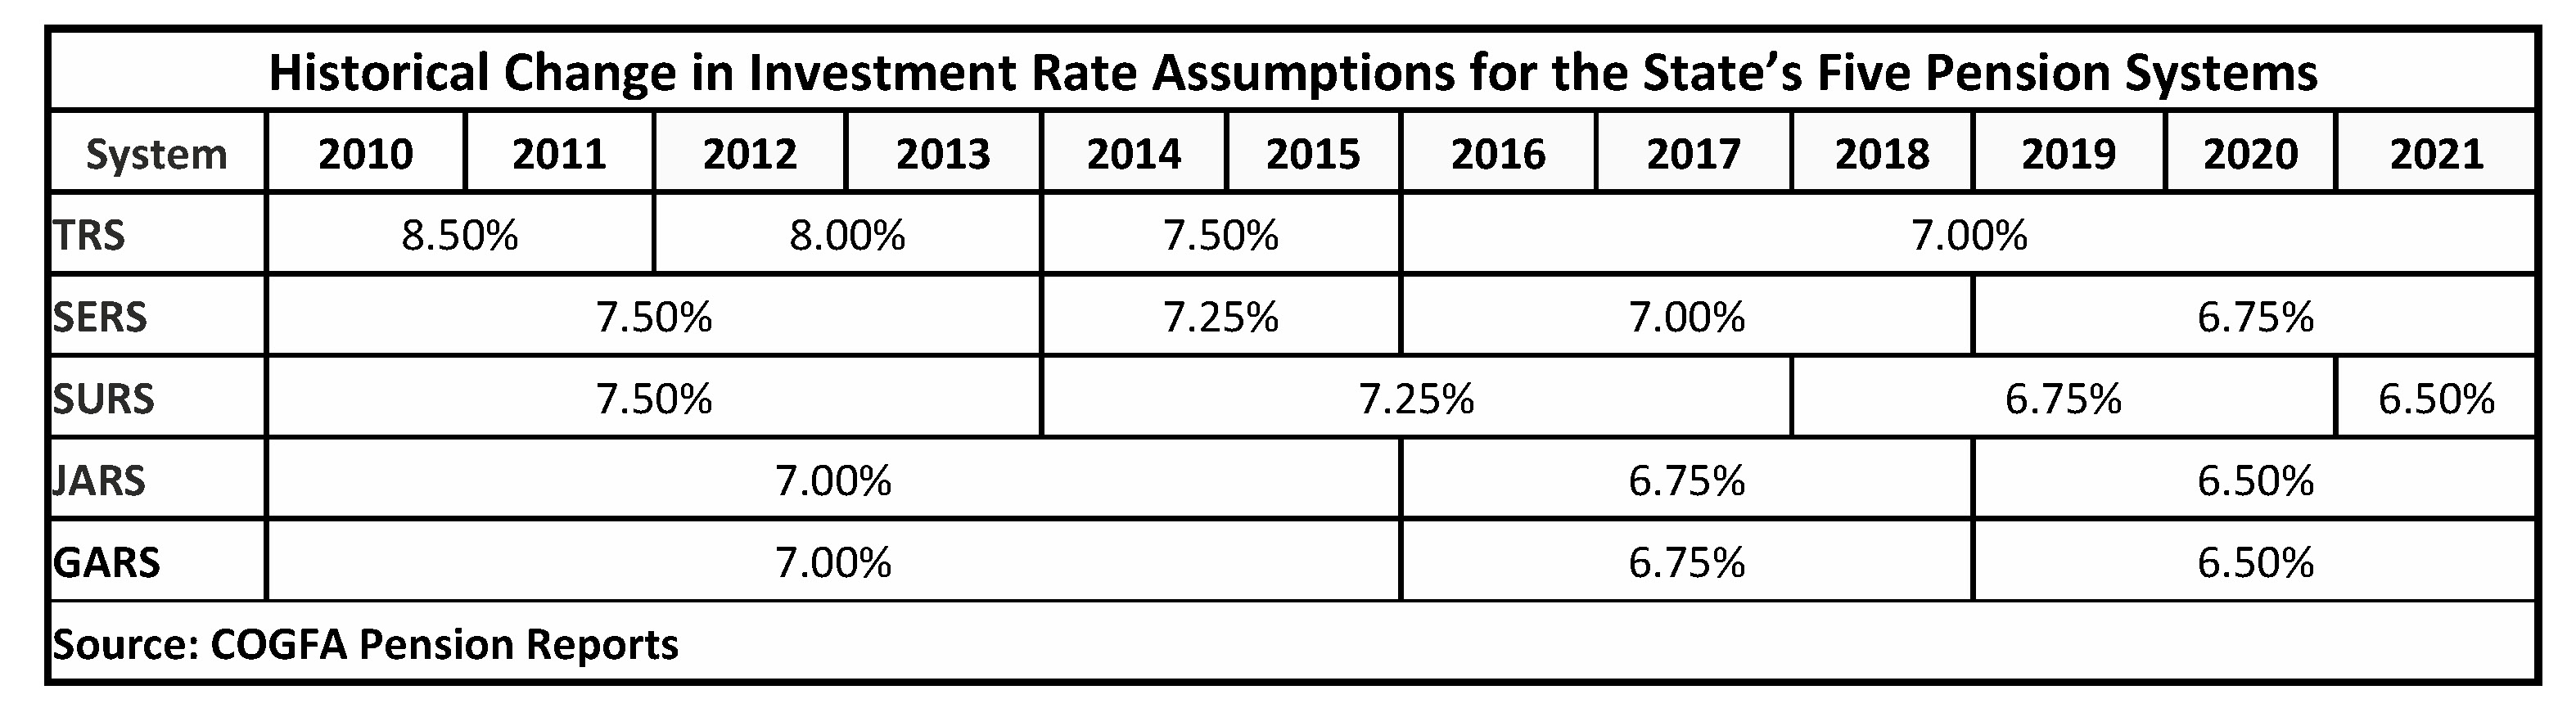
Chart 4 shows that the vast majority, 99% to be precise, of the benefits earned by members of the State’s pension systems have been earned by Tier I employees or inactive members which are predominantly Tier I retirees. Of the $243 billion of benefits earned, only $2.5 billion have been earned by active Tier II members. This shows that the increase in liabilities for the pension systems been almost exclusively driven by Tier I pensions and not Tier II pensions.
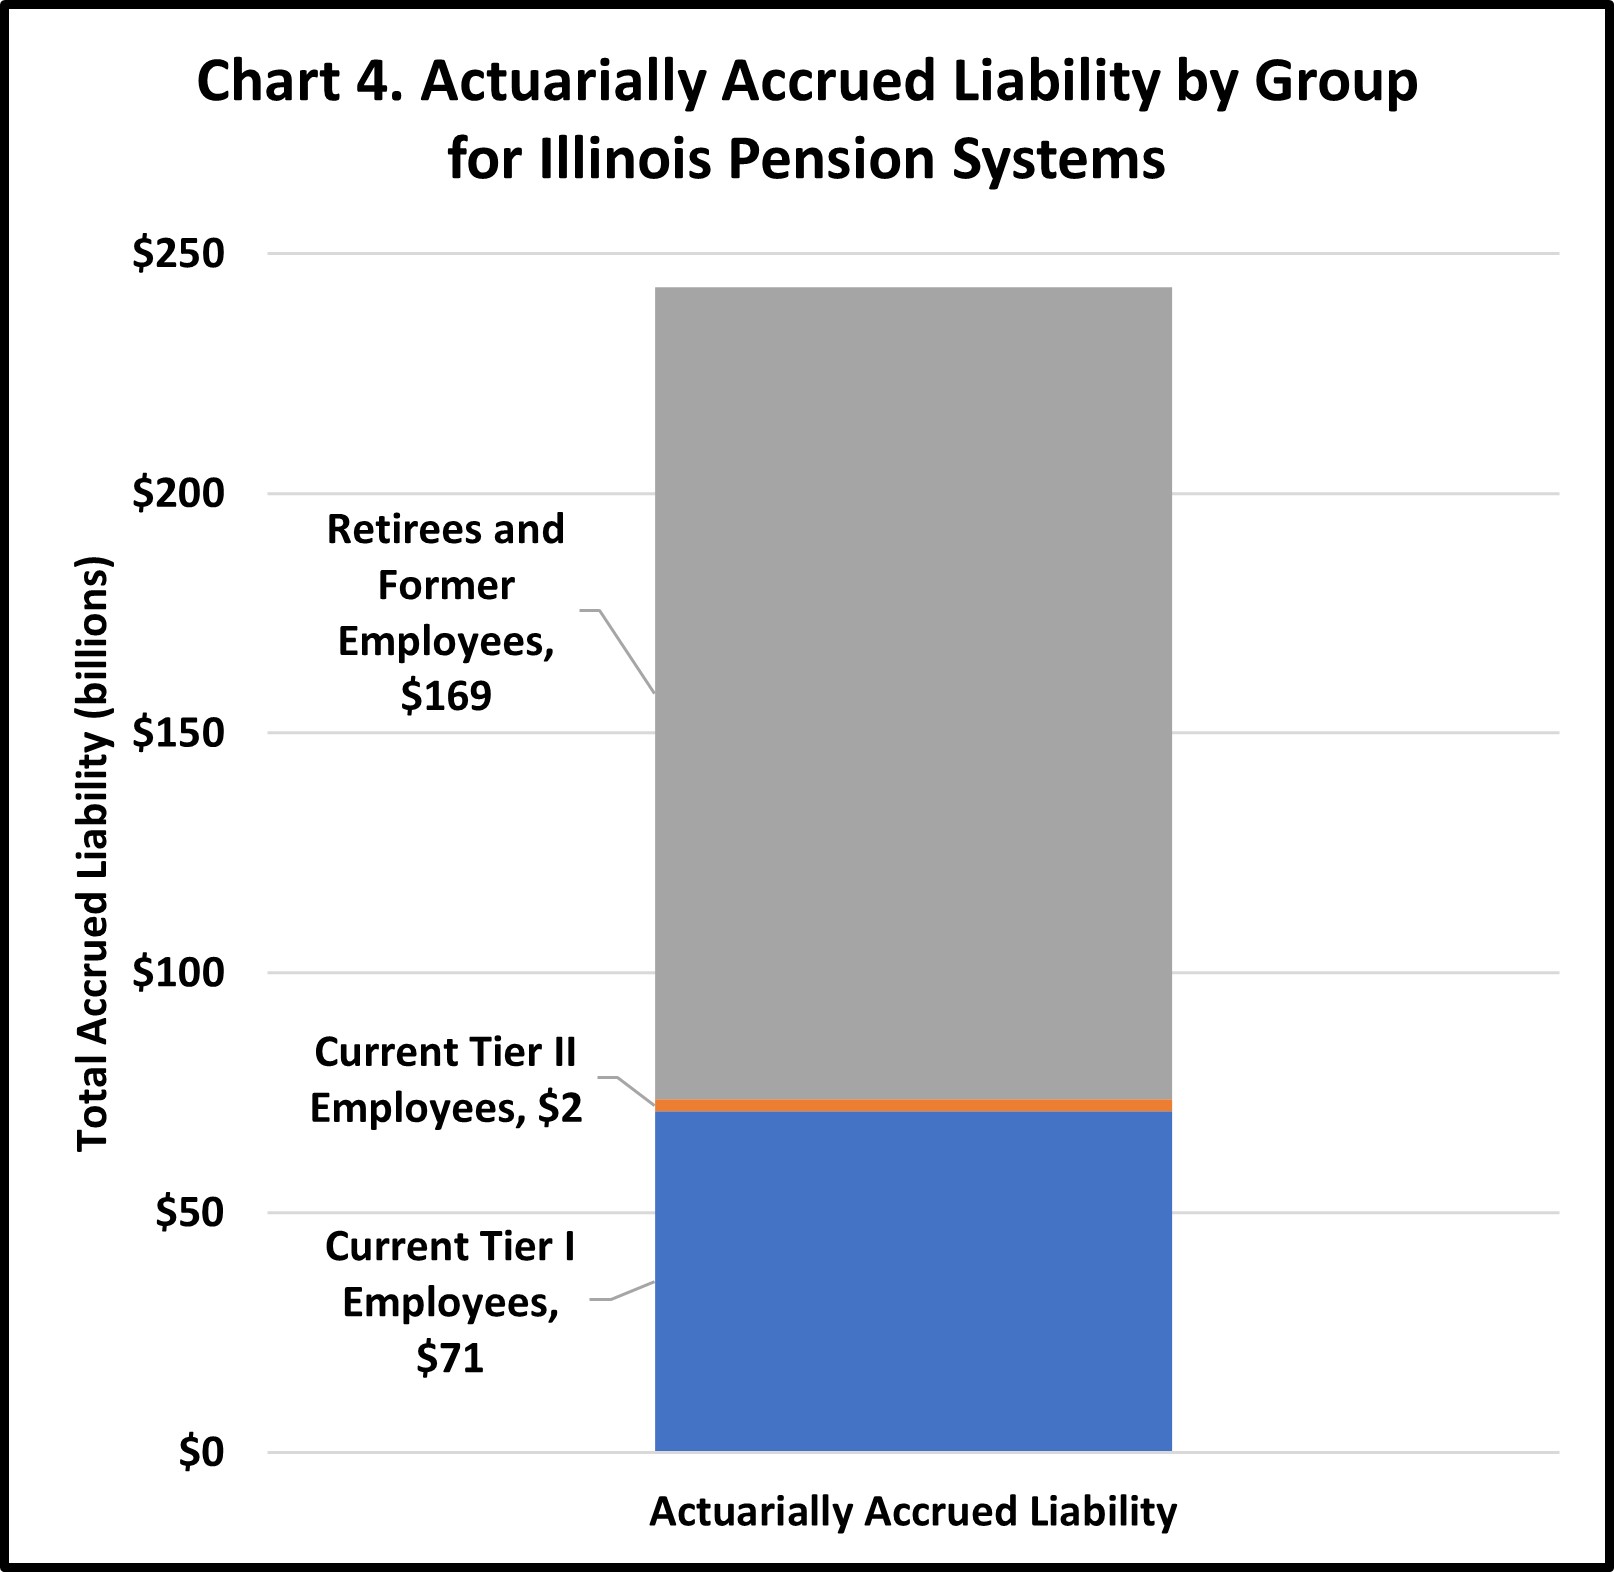
Even when looking only at active employees, the total liability of Tier II employees is 3% of the liability for all active employees even though 40% of employees in the five state pension systems are Tier II.
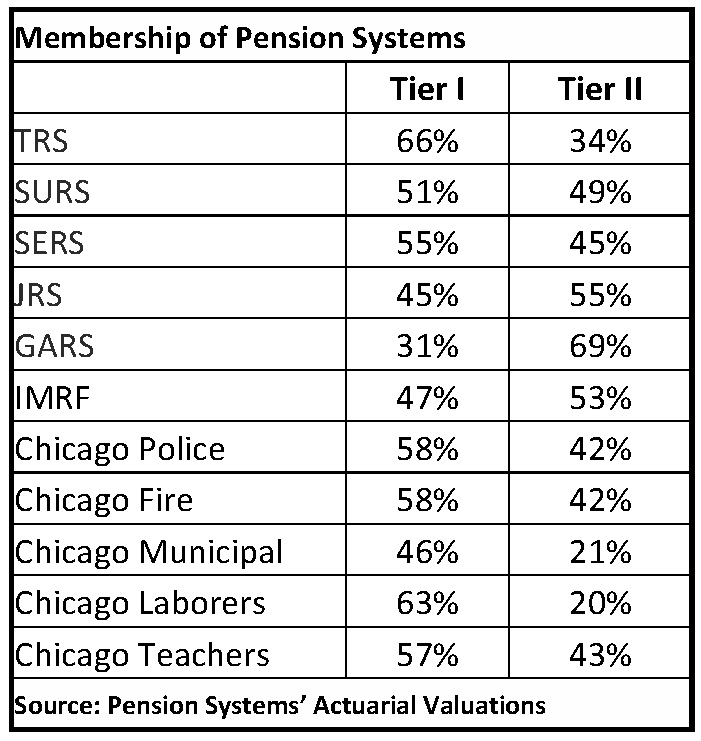
The table below shows the percentage of employees in each pension system that are Tier I and Tier II. Pension systems where employees are more likely to stay for a majority of their career (TRS or Chicago Police or Fire) have fewer Tier II employees as a percentage of their total employees. Systems with higher employee turnover have more Tier II employees. The General Assembly pension system has the smallest percentage of Tier I employees (the percentage would be even smaller but a significant number of legislators that would be Tier II have completely opted out of the pension system and thus are not included.)
The total pension liability today is higher than it was anticipated to be prior to the passage of Tier II, which on its face seems to show that Tier II has not accomplished its goal of addressing the state’s pension woes. However, this increase was primarily caused by the pension systems lowering the assumed rates of return, which increased the estimated cost of all pensions, and not just Tier II. Tier II benefits are inferior to Tier I benefits, but Tier I benefits still account for 99% of the total liability. As more Tier I employees leave state employment and are replaced by Tier II employees, the cost of benefits earned by the new Tier II employees will be lower than their Tier I predecessors, further helping the State get to its funding target of 90% by 2045.
What remains to be seen, of course, is if the State makes additional changes, and what impact they would have on these calculations. There have been proposals to “refinance” the unfunded liability by extending the funding target to a later year. The General Assembly could decide to increase Tier II benefits, which would increase the total liability. But if Illinois stays on the current path, and the pension systems meet their assumptions, in 2046, the State will see its annual pension payment drop by approximately 80%, or from $17 billion to merely $3 billion. Then the State will have the difficult decision of what to do with the “extra” $14 billion…
Footnotes:
1Pension benefits for future police officers and firefighters were reduced later that year by P.A. 96-1495
2In re Pension Reform Litigation, 32 N.E.3d 1