Overall State & Local Taxes – How Does Illinois Compare?
Overall State & Local Taxes – How Does Illinois Compare?
January 2022 (75.1)
by Maurice Scholten*
People frequently ask how taxes in Illinois compare to those in other states. The answer to that question depends on who you ask. Advocates for increasing government spending present statistics that show Illinois as a low-tax state, while those who want a more limited role for government present statistics that show Illinois as a high-tax state. Over the next few months, we will release a series of Tax Facts articles attempting to provide a true picture of where Illinois stands. We first look at the overall tax climate in Illinois, which includes income taxes, property taxes, sales taxes, excise taxes, and other taxes imposed by state and local governments.
Two key points about how we undertake this comparison of state taxes:
- First, it is imperative to look at state and local taxes combined. Some states pay for services with state funds, while others leave that funding to local governments and local taxes. Furthermore, a person buying $100 worth of groceries and other household goods usually does not know (or care) who imposed the sales tax on those goods, and which government receives the tax.
- Secondly, we contend that tax collection rankings should reflect different economies in different states (which often reflect different costs of living and income levels). For example, let’s assume States A and B both have a flat income tax rate of 5%, but in State A the median personal income is $50,000, and in State B the median personal income is $55,000. As a result, the median State A resident would pay $2,500 in income taxes and the median State B resident would pay $2,750. Even though the two states have the same rate, the State B resident pays more in absolute dollars, but she also has more after-tax income. Does State B have higher taxes, or are they equal? We would posit that they are equal, so a per capita comparison would not adequately capture the differences between State A and B. To reflect this properly, we look at taxes as a percentage of gross state product (the total value of all goods and services produced within the State) to arrive at the percentage of economic output diverted to taxes.
Finally, in terms of presentation, rankings make good headlines, but the bar graphs we use make it easier to visualize if a state is an outlier, and if so by how much. For example, if a state has the highest taxes in the country but is only slightly higher than the national average, then that #1 ranking means very little, because all the states have essentially the same tax burden. On the other hand, if a state is ranked 10th but it is significantly above average, the fact that nine states have higher taxes does not provide much comfort to that state’s citizens.
We use the most recent data that the Census Bureau has released, which is for FY 2019. This data predates COVID-19 which has had a significant impact on everything, including state and local taxes. We will update these charts when the Census Bureau releases updated data.
ILLINOIS TAXES ARE ABOVE AVERAGE
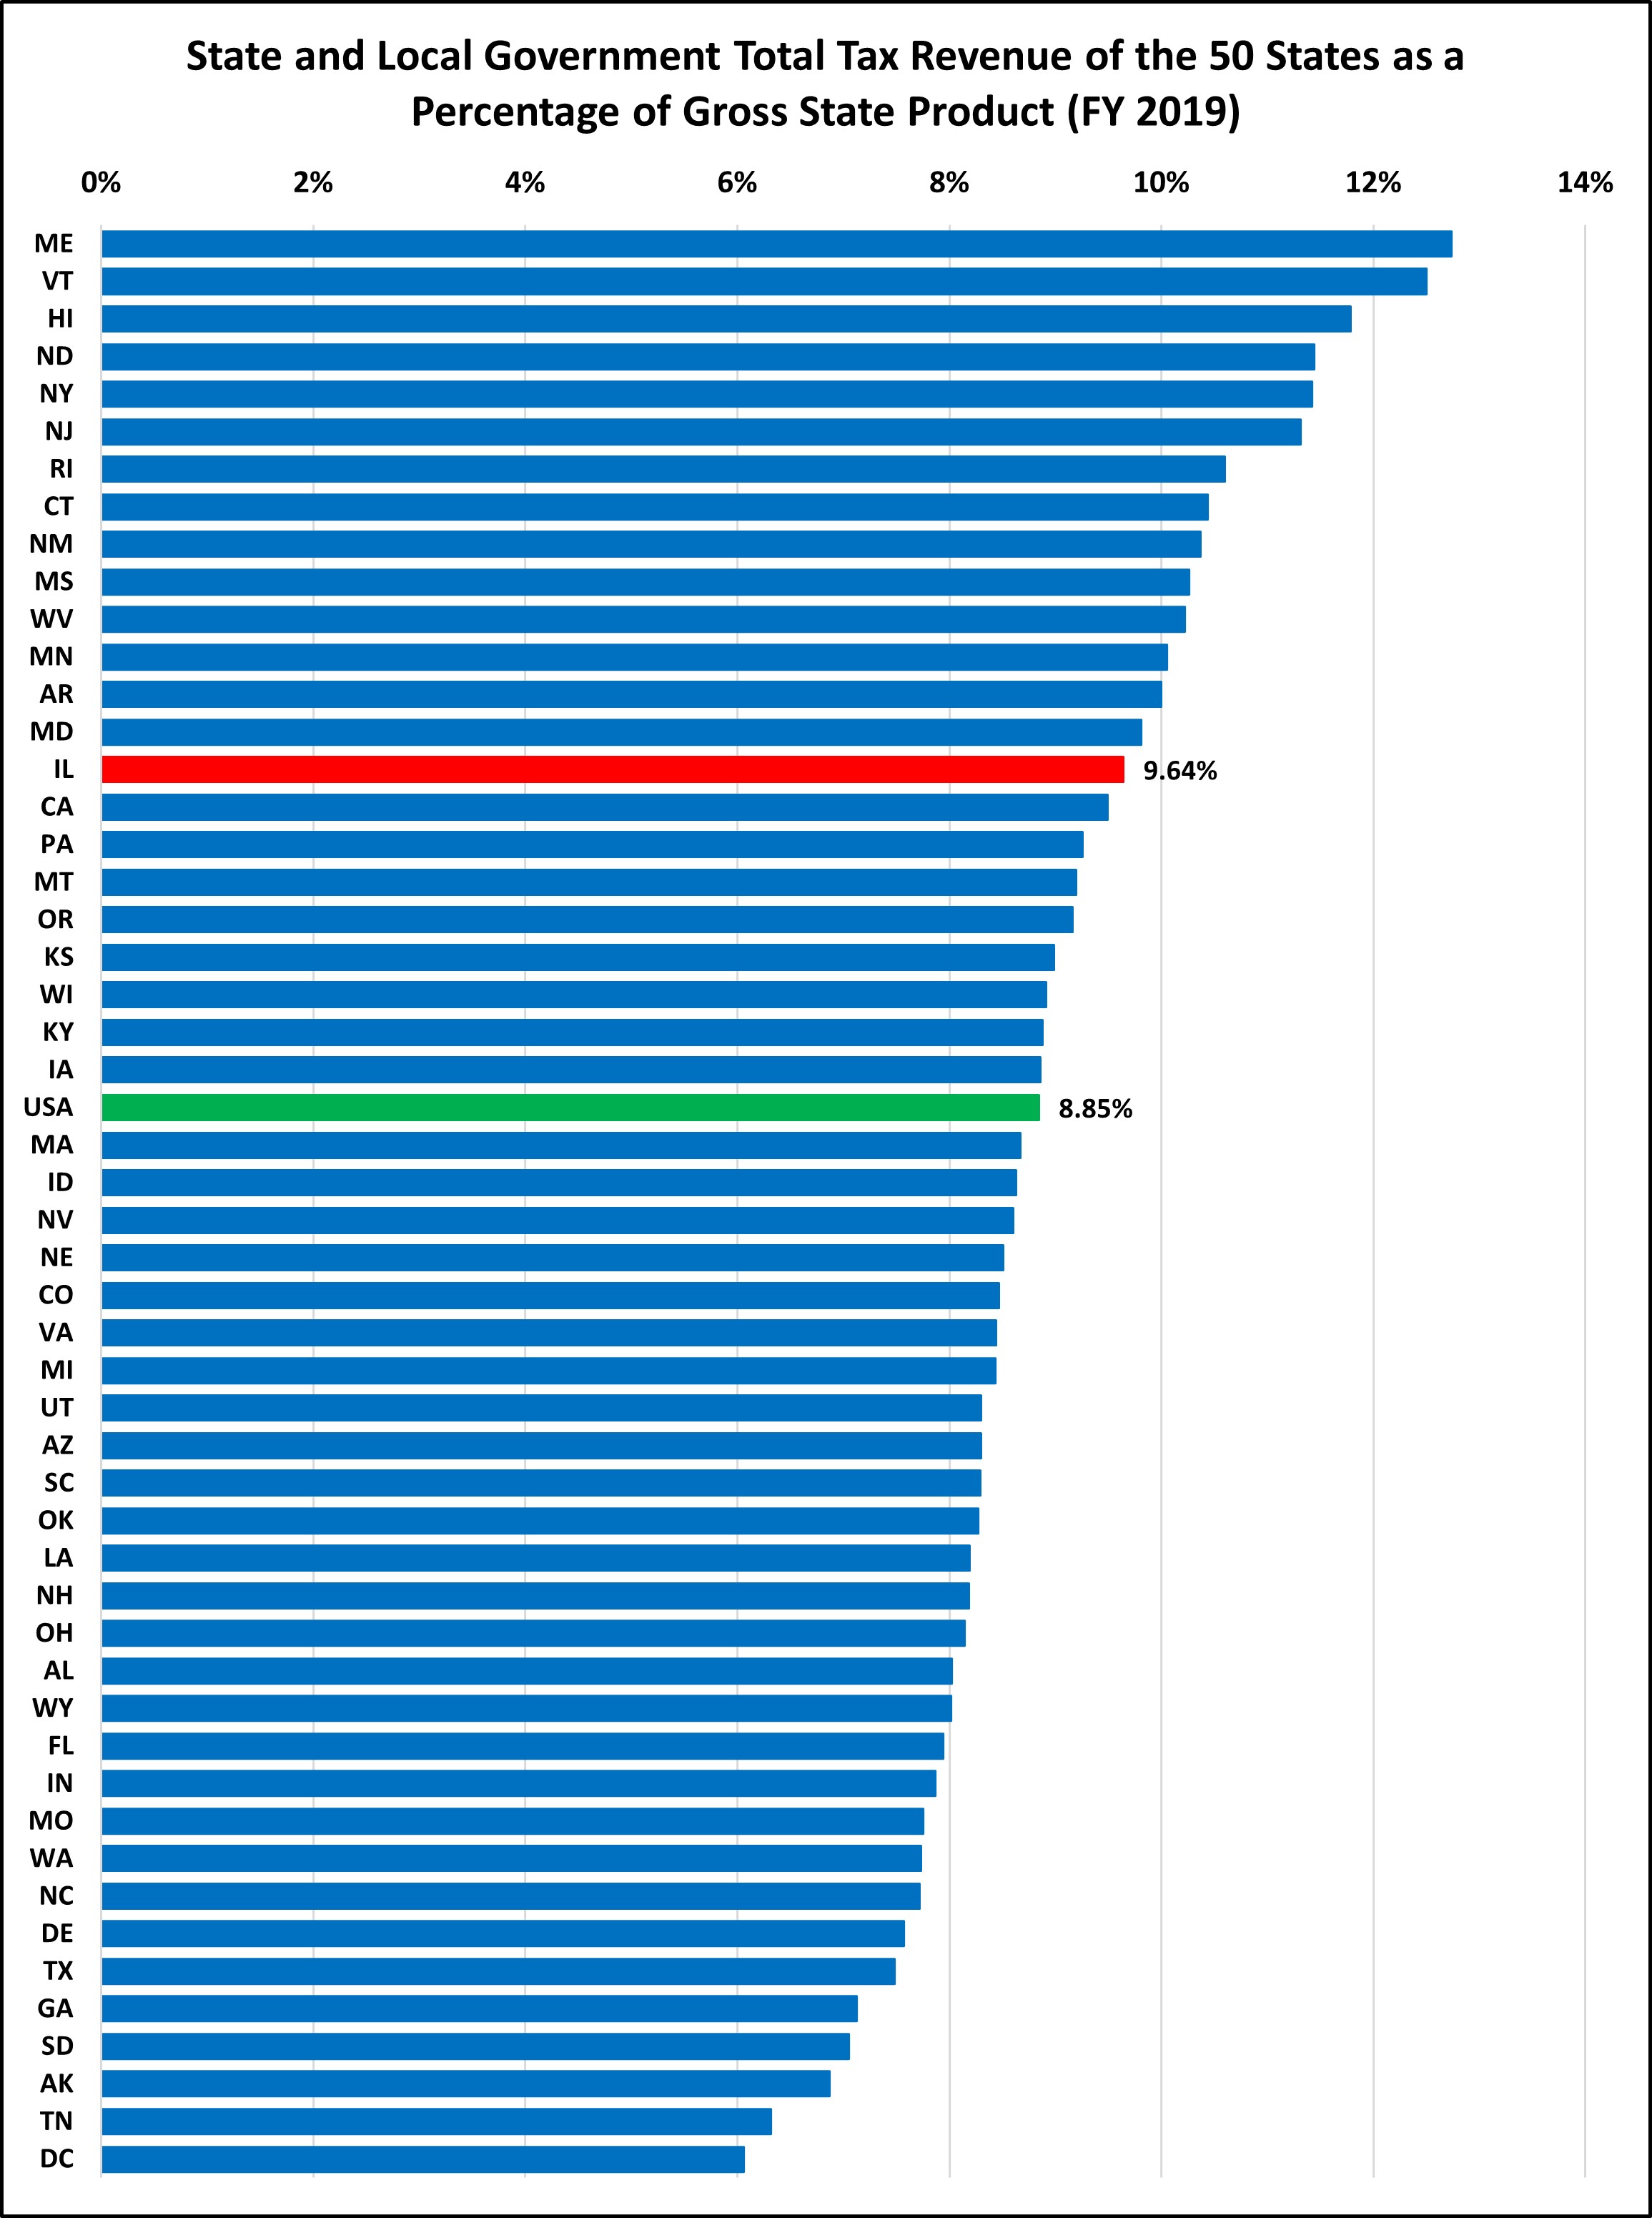
In FY2019, Illinois had the 15th highest total tax collections, at 9.64% of gross state product, 8.9% higher than the national average. In total, Illinois collected $84.3 billion in state and local taxes, which is $7.0 billion more than would have been collected had Illinois been at the national average.
ILLINOIS’ TAX COMPILATION IS FAIRLY TYPICAL
State & Local Tax Collections by Type (FY 2019)
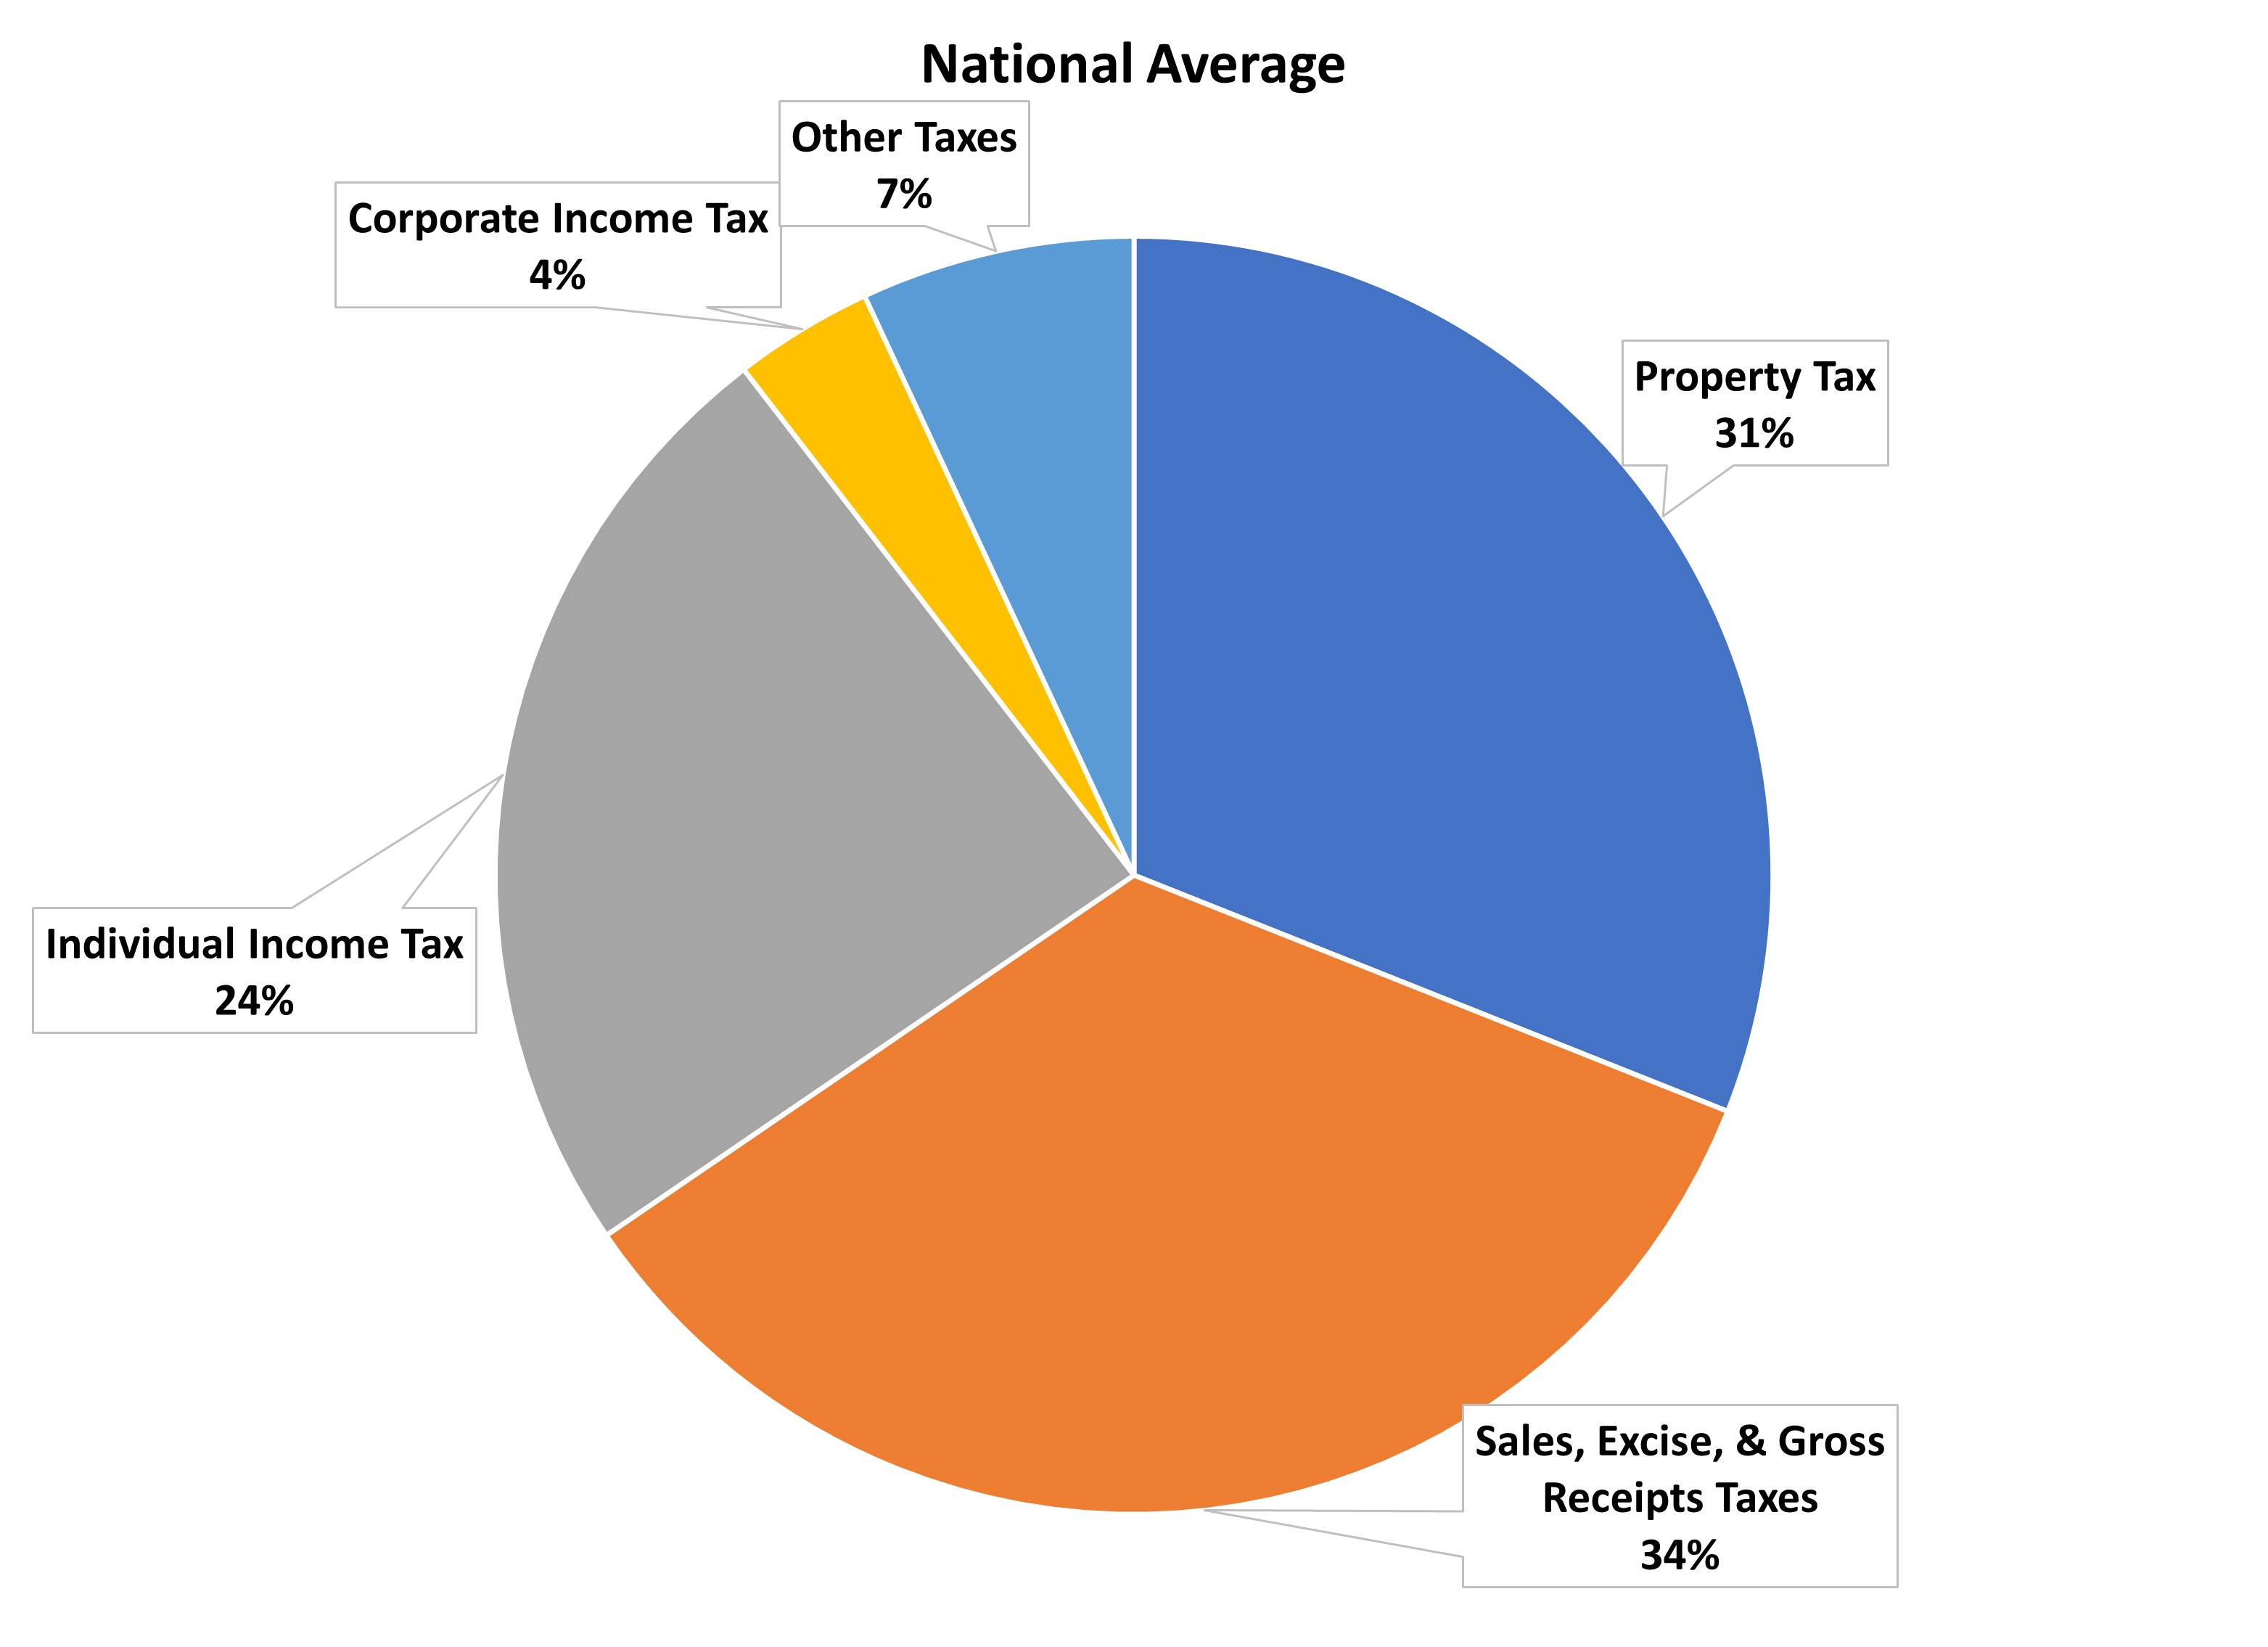
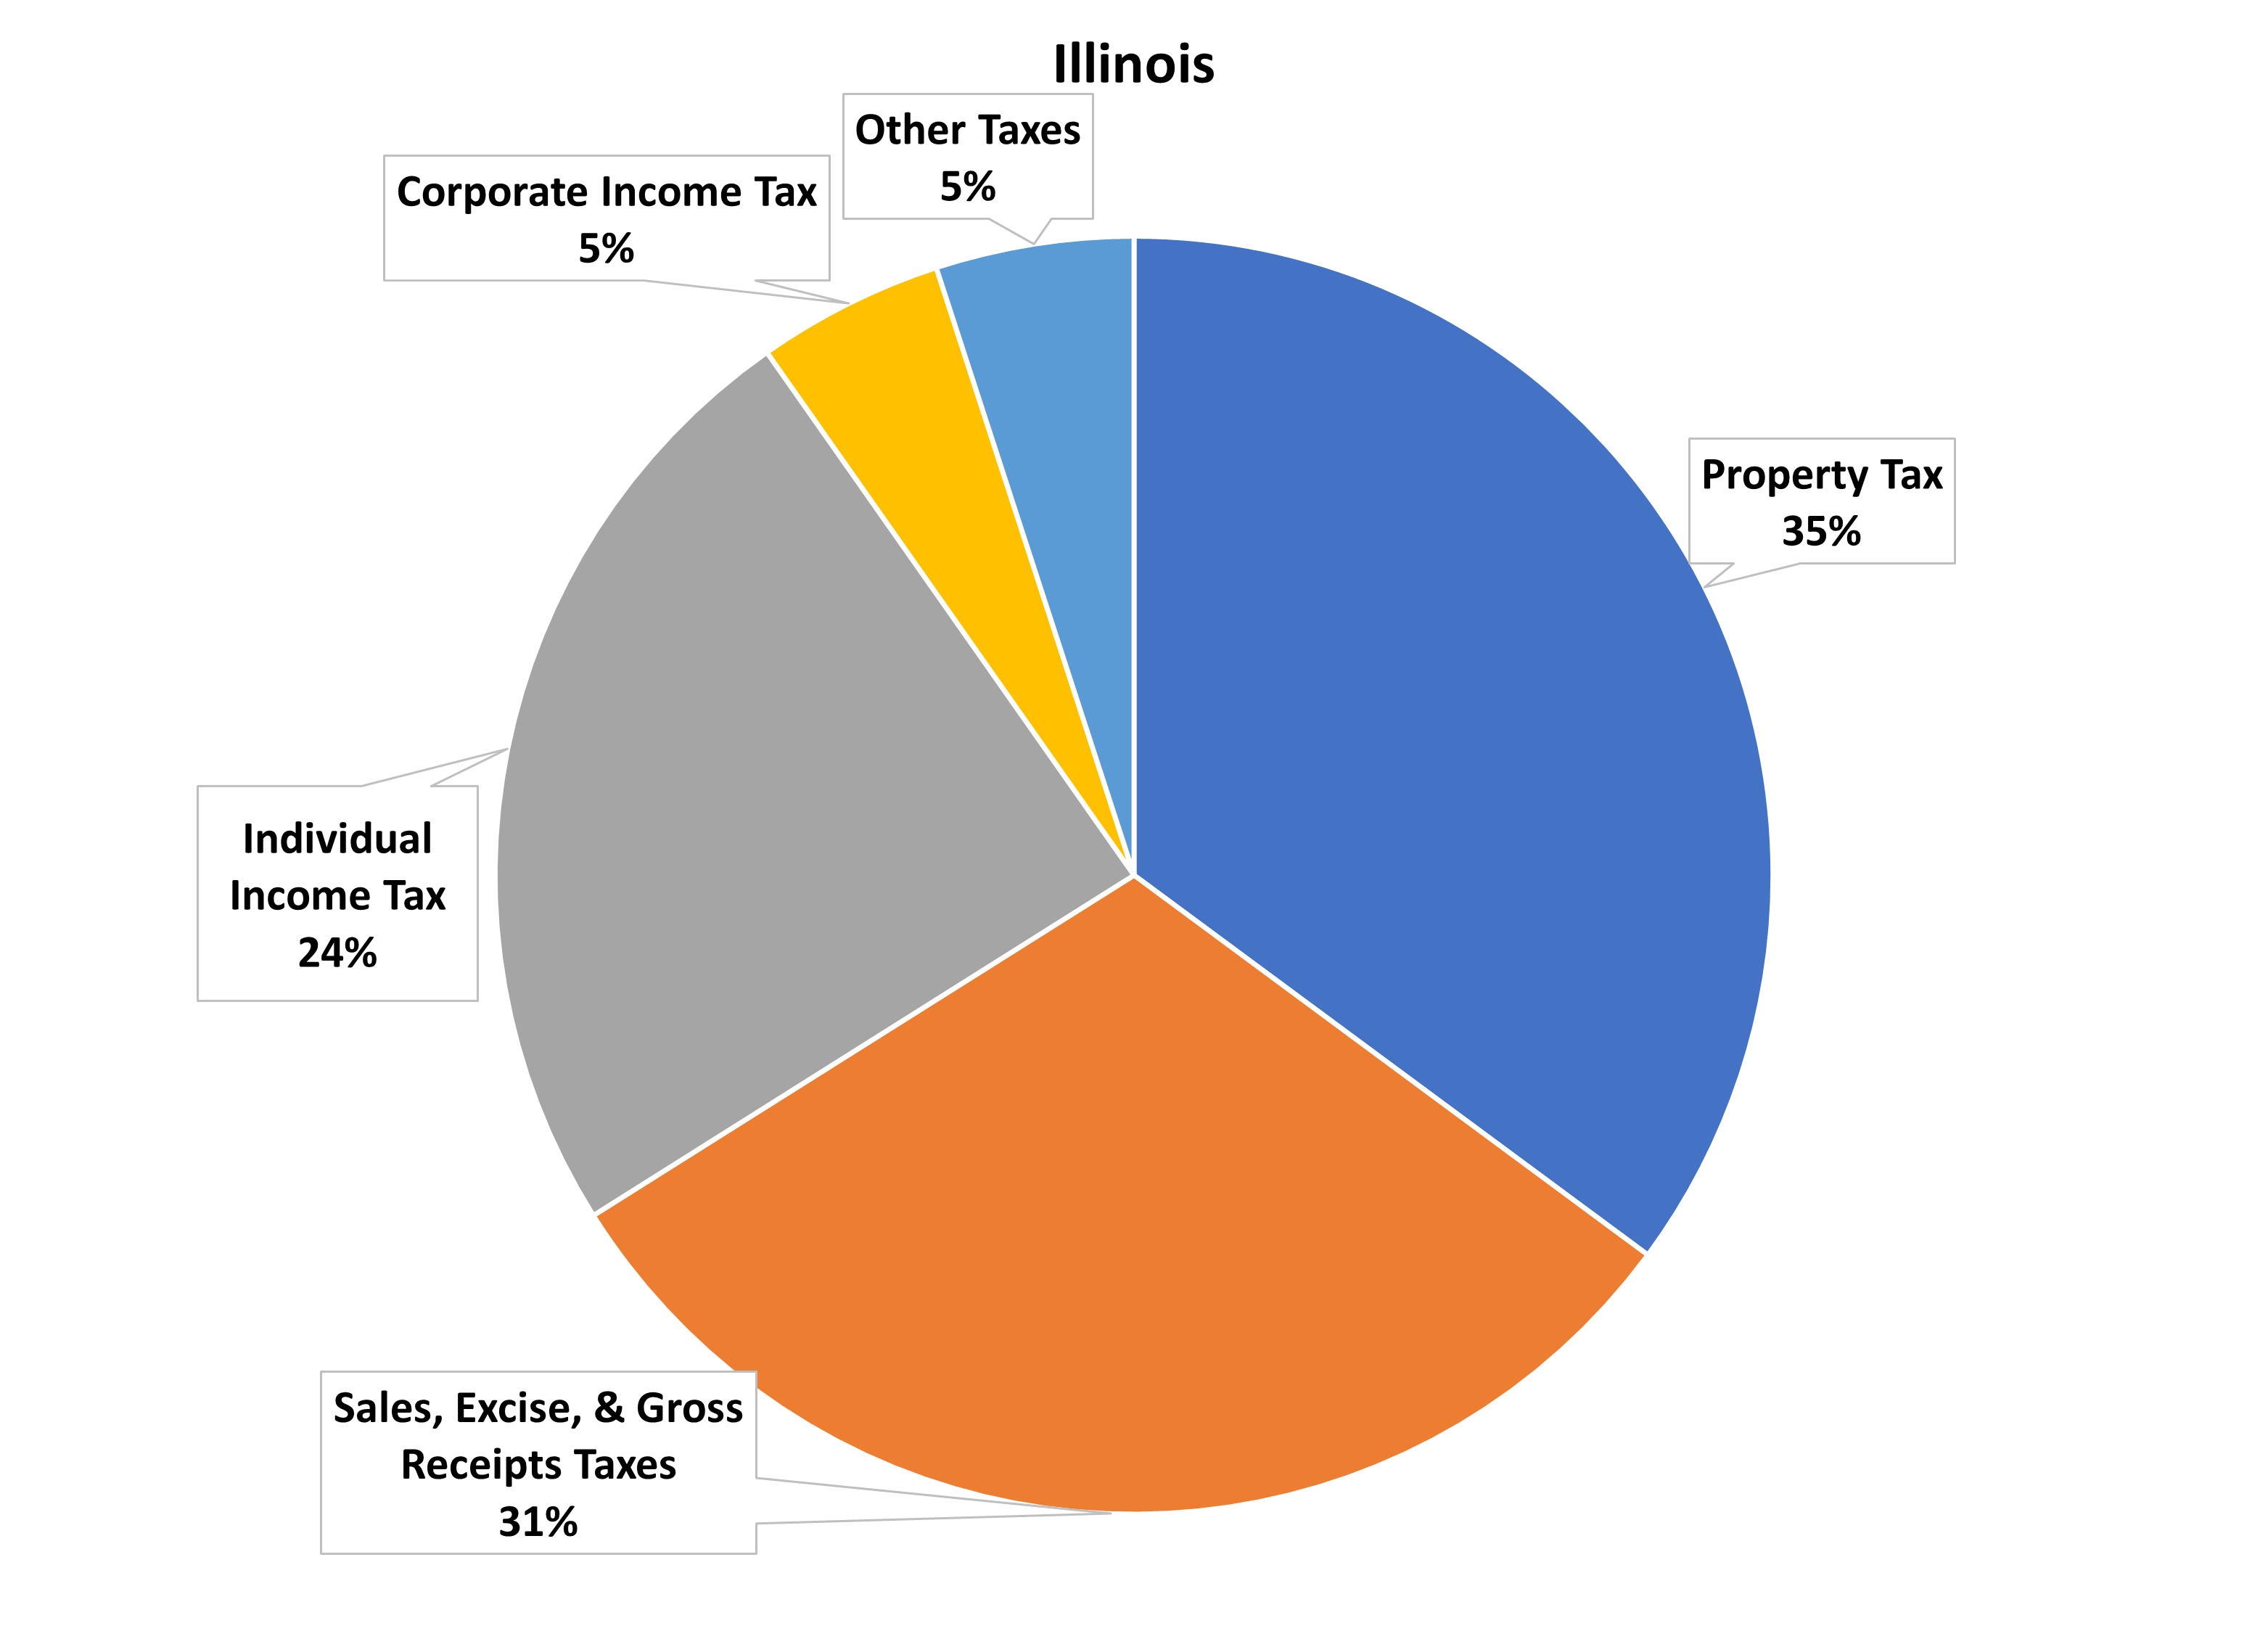
These charts show the extent to which Illinois relies on certain taxes compared to the national average. Overall, the relative makeup of Illinois’ total tax collections is fairly typical. Illinois relies on property taxes more so than the average state, which shouldn’t be too much of a surprise to Illinois residents. Conversely, Illinois relies less on sales, excise, and gross receipts taxes than the average state. States that do not impose an income or sales tax would naturally have very different looking charts.
PER CAPITA TAXES IN ILLINOIS ARE HIGH
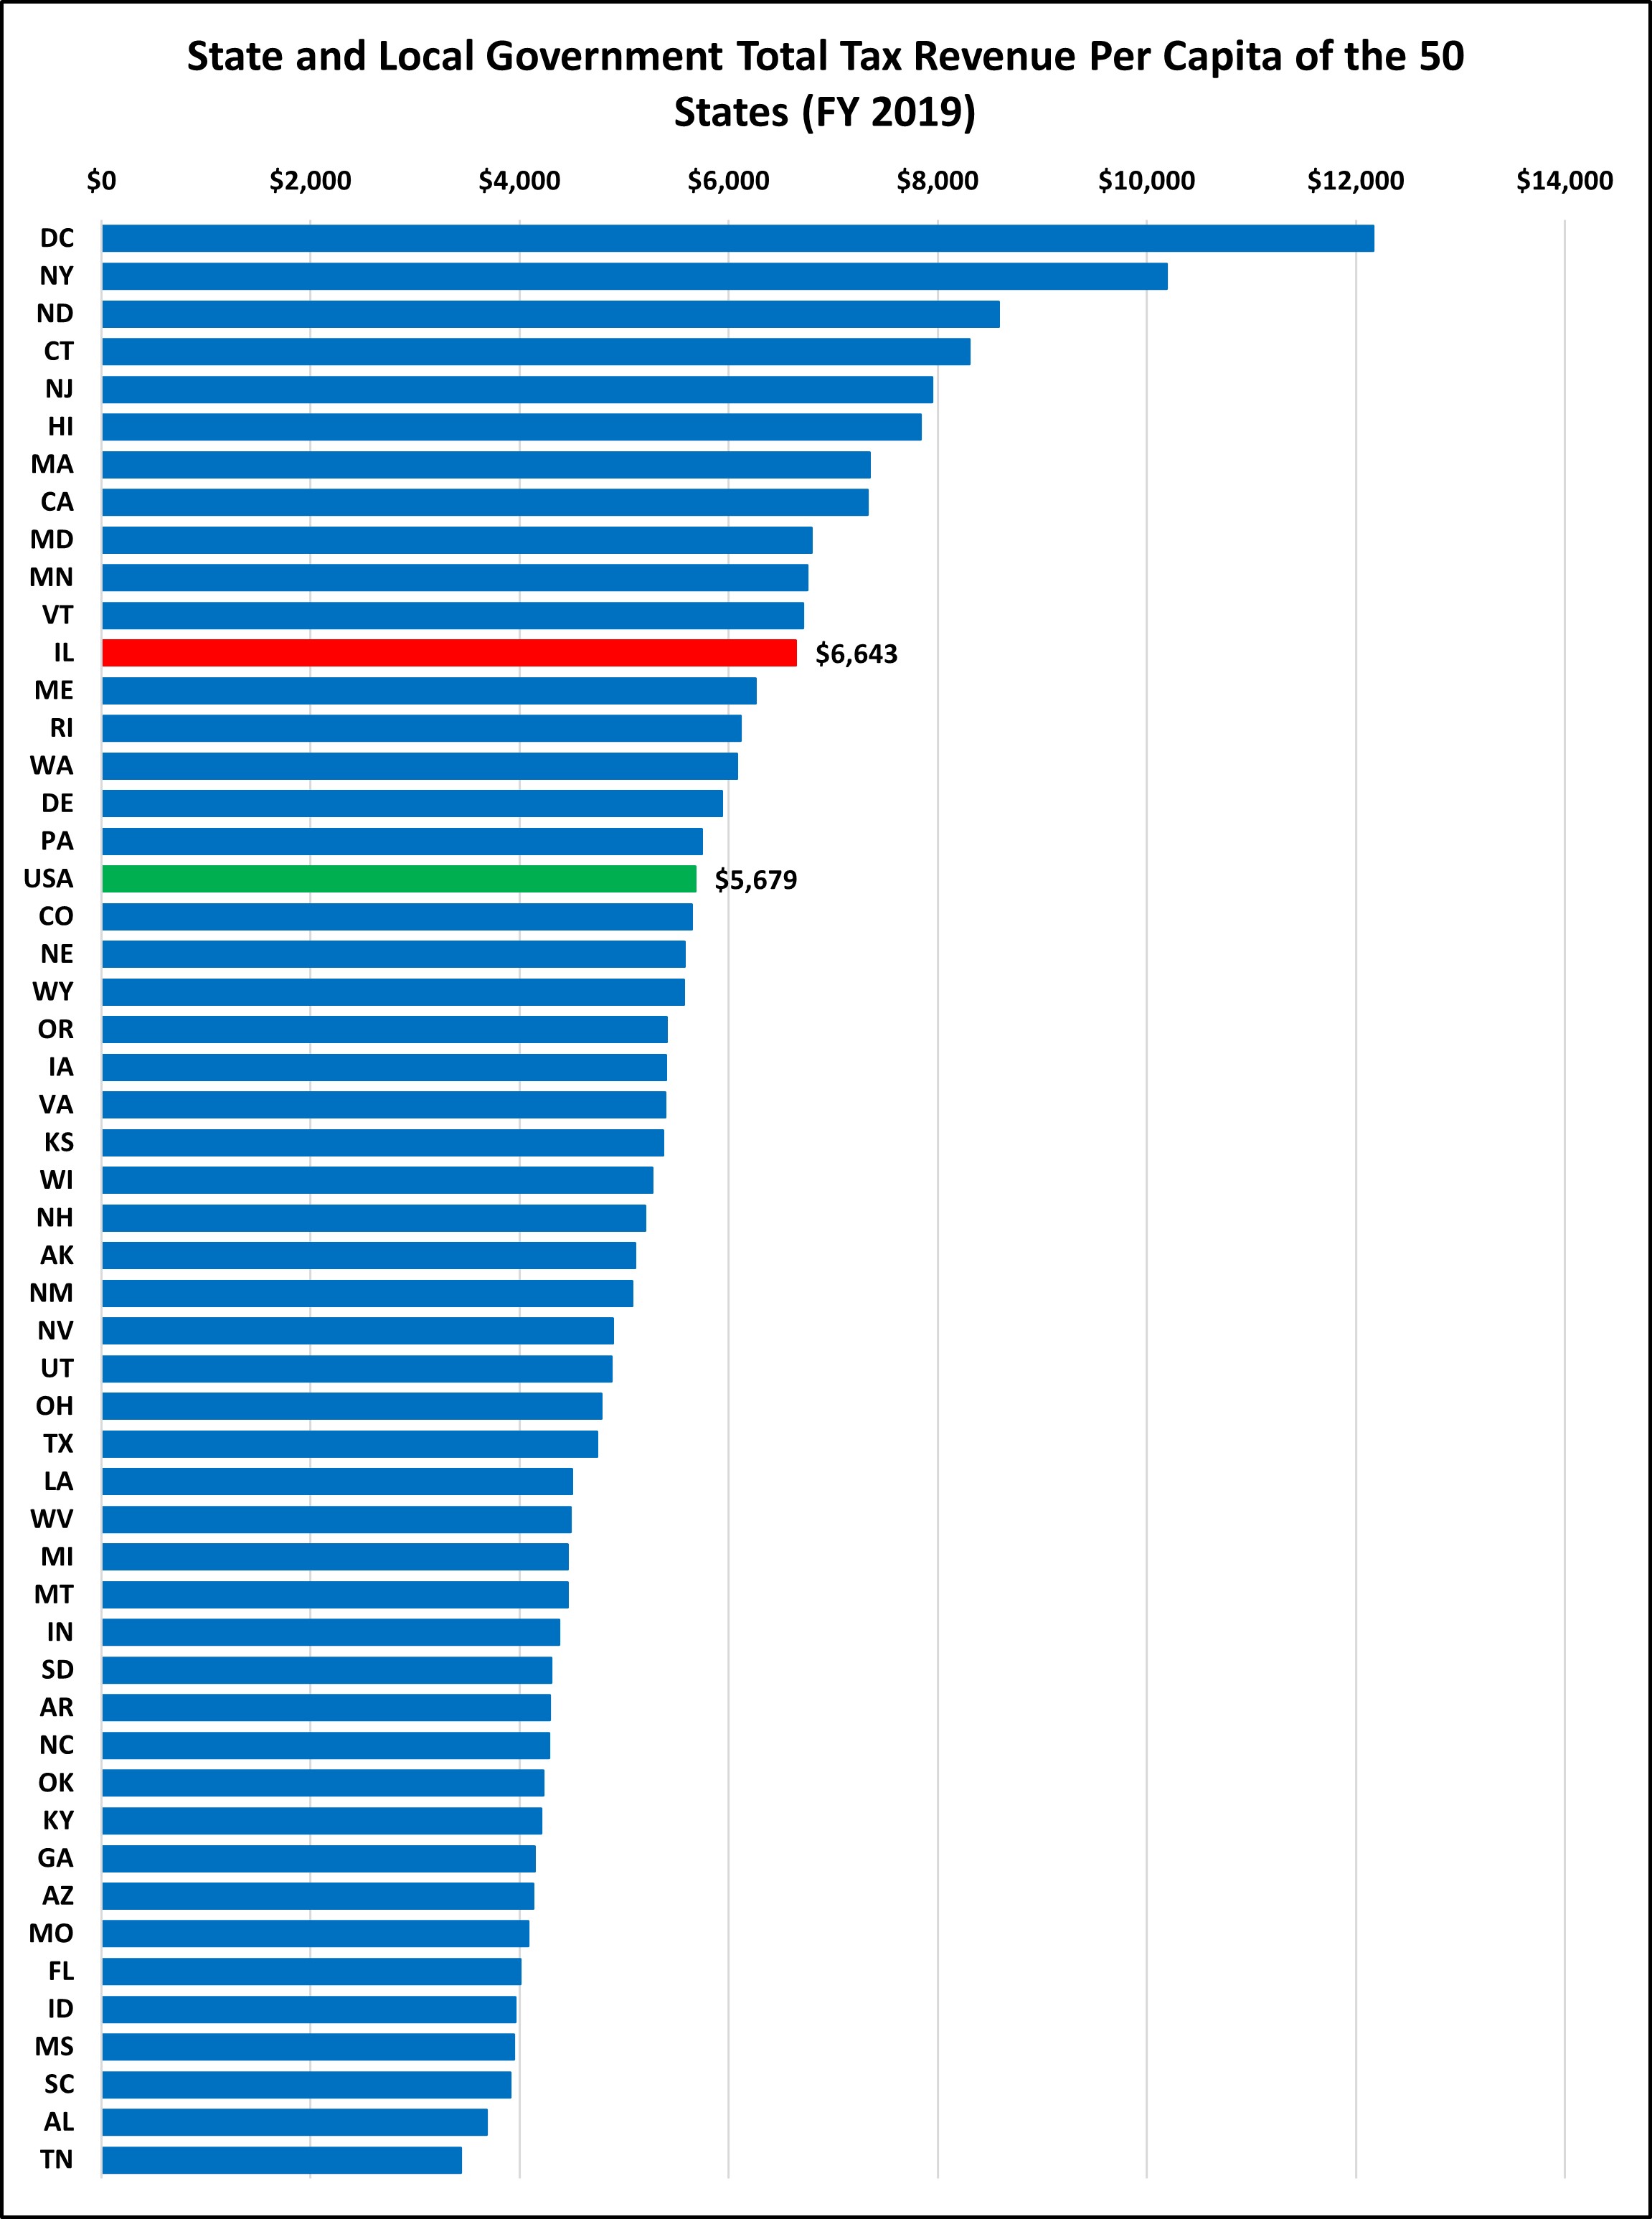
Although per capita measurements fail to consider the states’ different economies, they still have a purpose. When we say Illinois’ state and local taxes are 9.64% of gross state product, most people don’t know what that means to them personally. Saying that Illinois’ state and local tax burden is $6,643 per person, on the other hand, is easier to understand (even though few people would pay this exact amount). The national average per capita state and local tax collection is $5,679, while Illinois collected $6,643 per person in FY 2019.
Different numbers looking at the same thing – taxes in Illinois – can paint different pictures. Illinois collects more state and local taxes than average as a percentage of gross state product as shown above, and on a per capita basis as shown below, but under one measurement (gross state product) Illinois is 8.9% above average, while under the other (per capita) Illinois is 17.0% above average. This is a significant difference: using per capita figures, Illinois’ taxes are $12.2 billion above average, but only $7.0 billion above average using the gross state product comparison.
ILLINOIS OWN SOURCE REVENUES TELL A DIFFERENT STORY
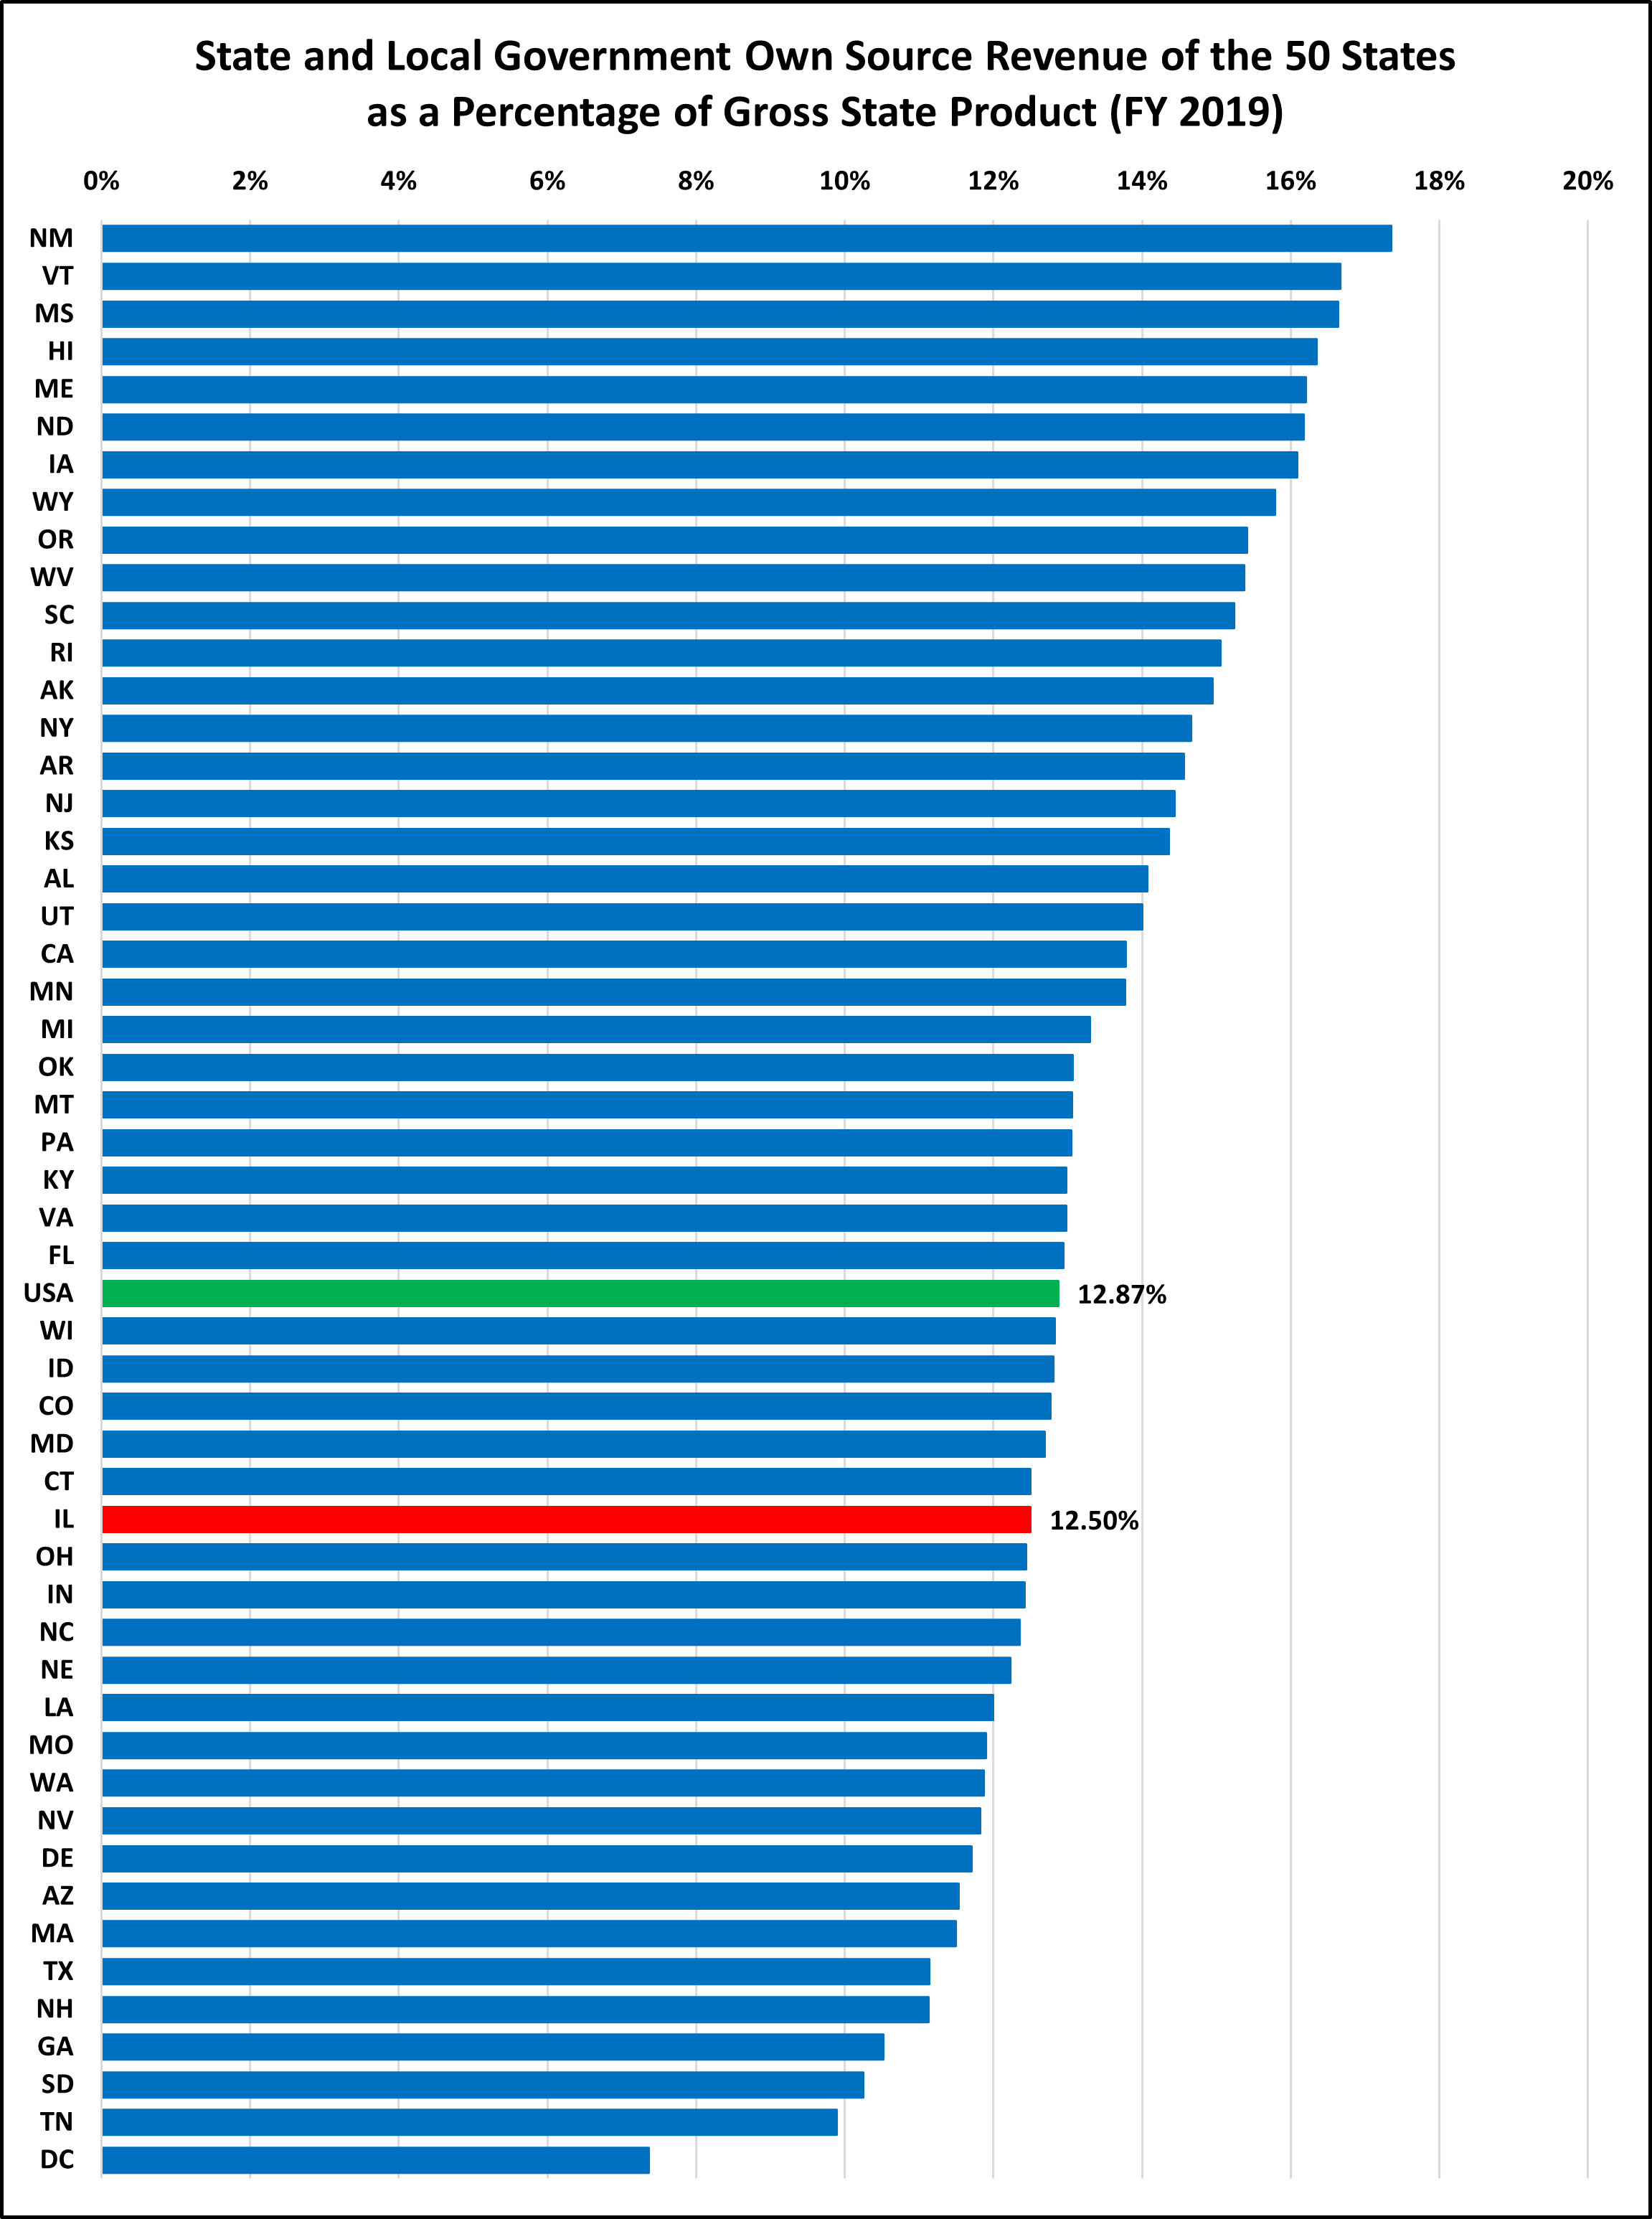
So far, we have compared total tax collections in Illinois (which includes income, sales, property, excise, utility, and other miscellaneous taxes) to collections in other states. We have not looked at other revenues that state and local governments receive, such as fines, fees, college tuition, tolls, and other similar revenues. One can argue that a more inclusive figure (commonly called own source revenue) is a better measuring stick, since a person doesn’t care if a payment they make to a government is a fee or a tax–it is still going to the government. However, most fees are for a specified service (or should be), such as parents paying a sports fee for their child to play high school soccer or a driver paying a highway toll. And the revenues from these fees are generally used to fund that specific service (the soccer team or highway), rather than for general government purposes. It can be useful to look at this more inclusive figure, which shows that Illinois is below the national average.
Tax revenues are above average, according to one of the previous charts, but total own-source revenues are below average, which seems contradictory. What is driving this difference? Own source revenue does not include revenues from government run utilities and liquor stores, but does include revenues from government run hospitals. Illinois’ state and local governments collect only $173 per capita from government run hospitals while the national average is $557 per capita. Nationally, 19% of hospitals are run by state and local governments. In Illinois, that figure is 12%, which explains why we collect a below average amount. If Illinois were at the national average, we would collect an additional $4.9 billion in hospital revenue. However, governments that collect hospital revenue need to provide medical care in exchange for those payments. If Illinois wanted to increase the hospital revenue figure, our state and local governments would also have to increase the number of, and amount of expenditures on, government hospitals. Increasing hospital revenues would not guarantee any additional funding for other state functions or otherwise alleviate Illinois’ tax burden.
While this own-source revenue comparison may be useful for some purposes, understanding it requires looking at what is driving the difference: where is Illinois significantly below average, and where are we significantly above average. In this case, Illinois’ below average ranking is mainly due to fewer government operated hospitals in Illinois.
REMOVING HOSPITAL REVENUE RAISES ILLINOIS’ RANKING
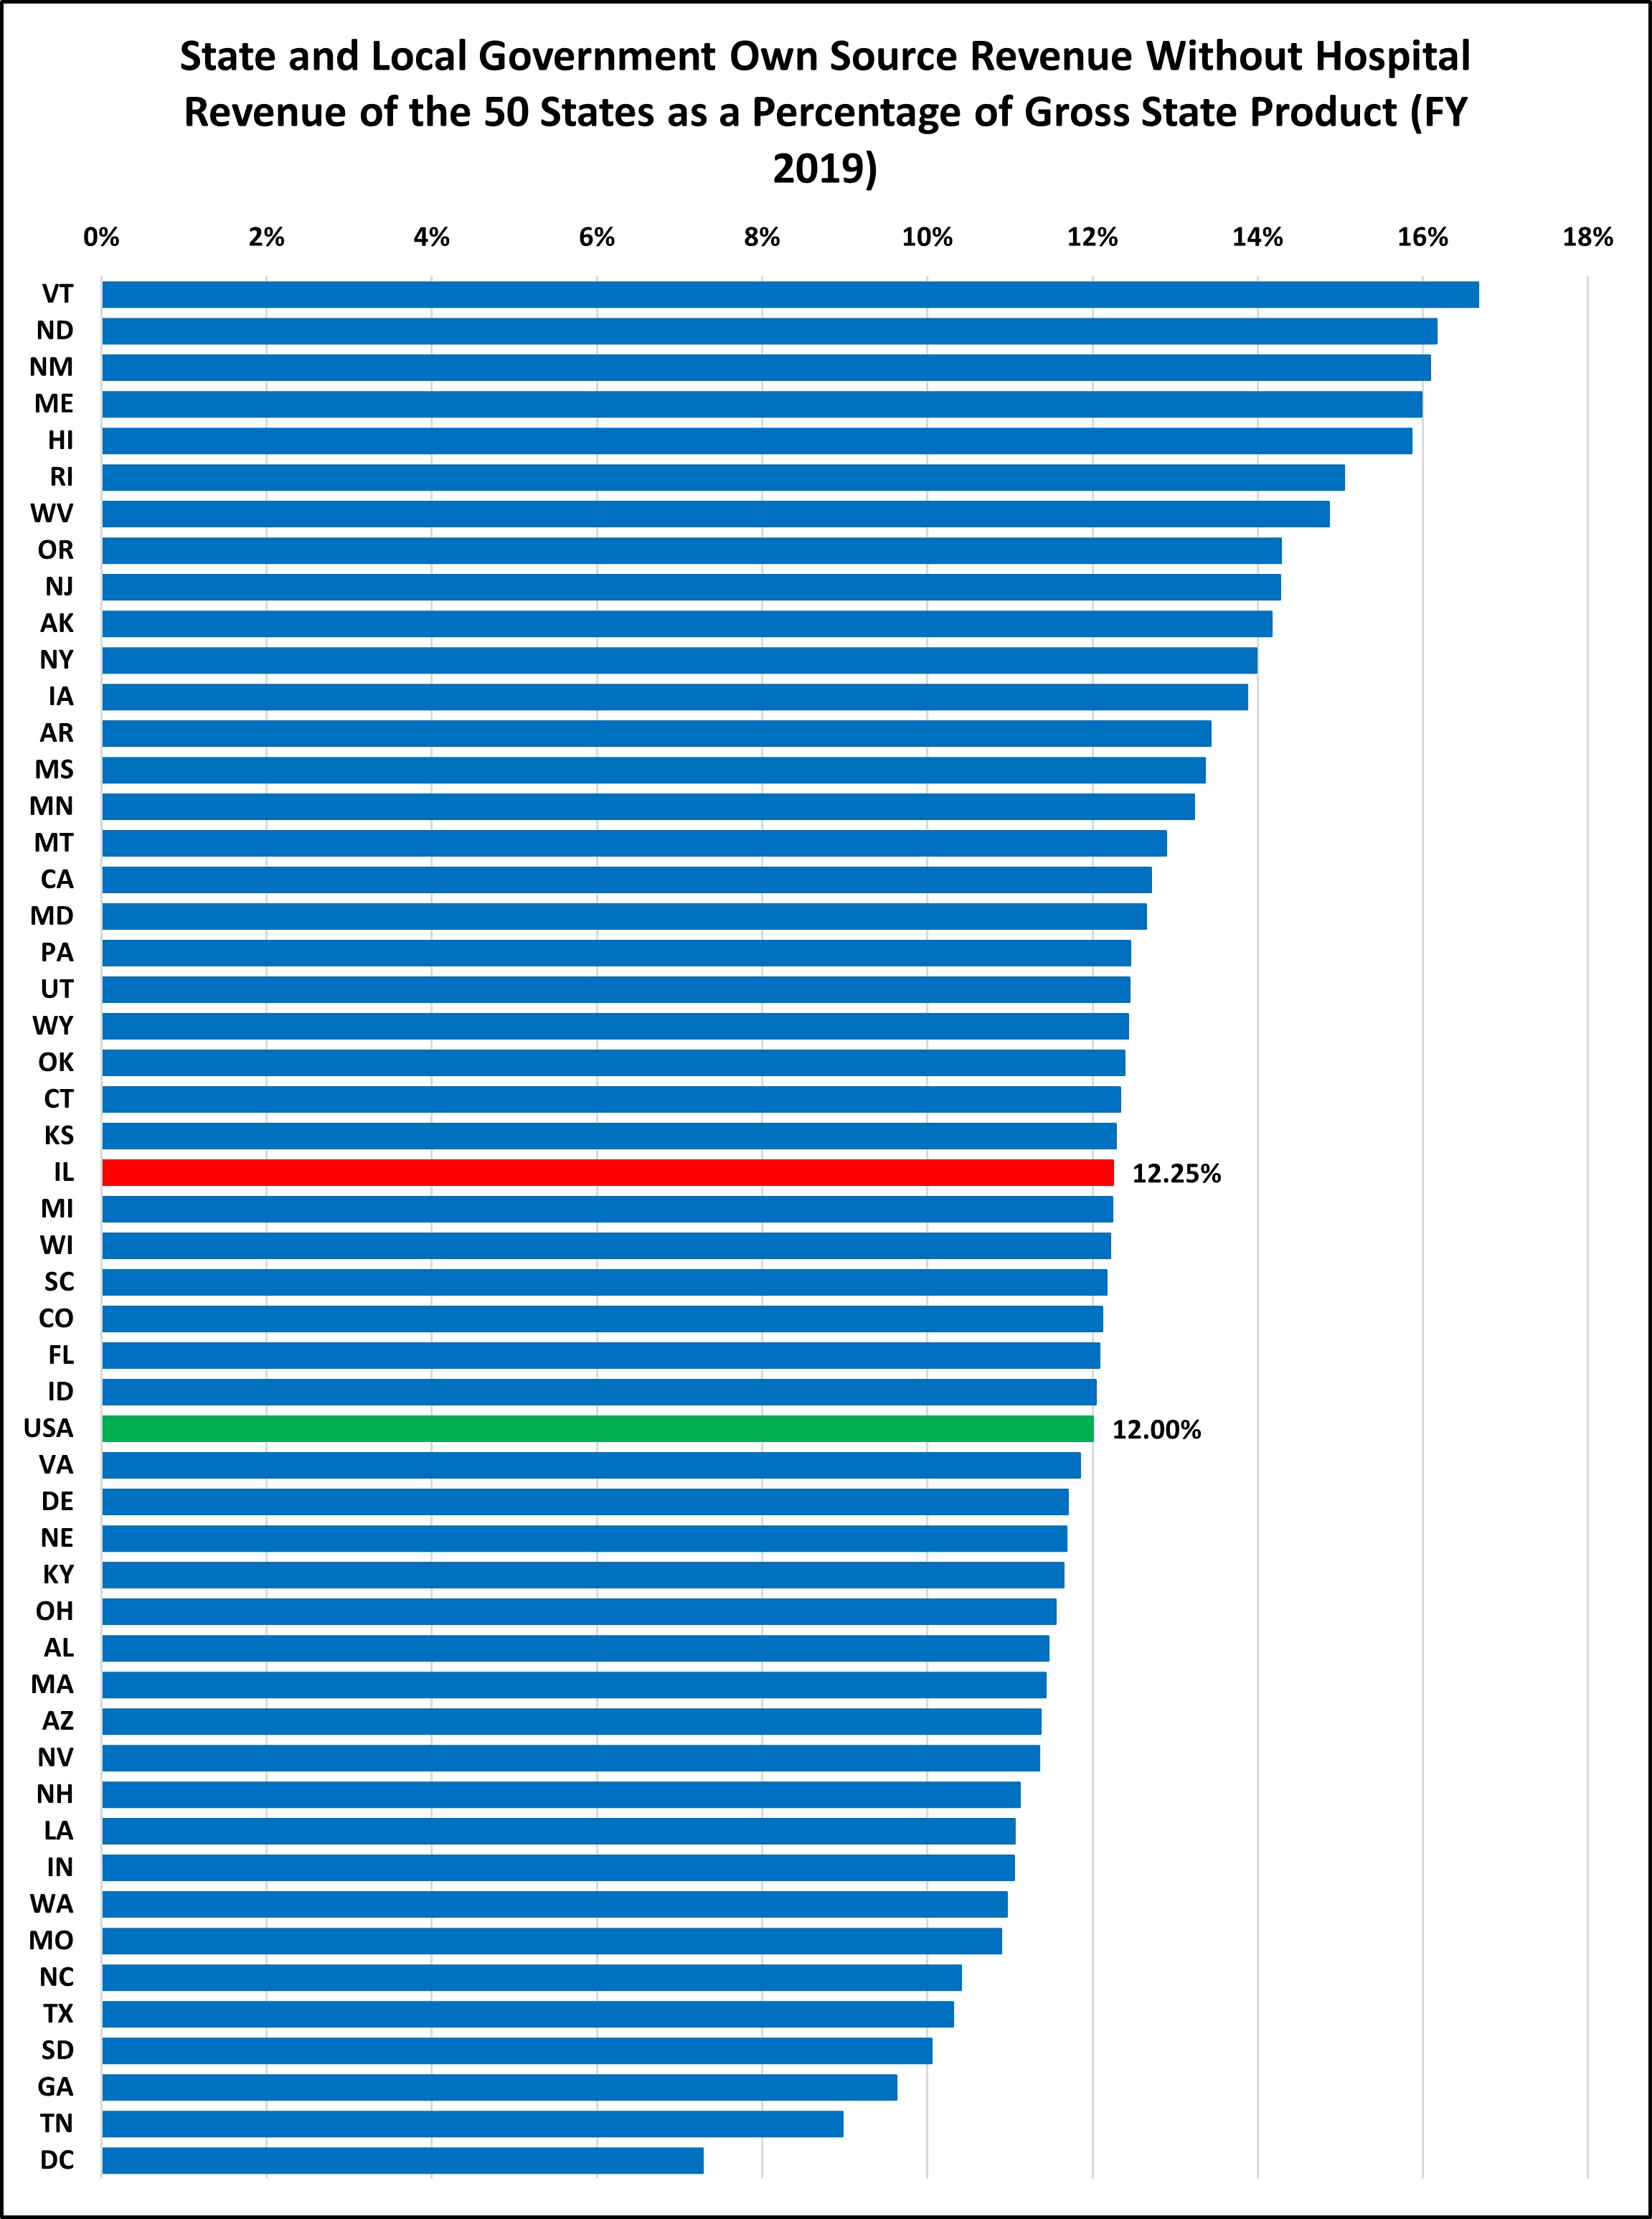
When government hospital revenue is removed from the own-source revenue data, Illinois’ ranking increases. Illinois went from below average to slightly above average, meaning Illinois is not much of an outlier after all.
UNTIL RECENTLY, ILLINOIS TAXES HAVE BEEN BELOW AVERAGE
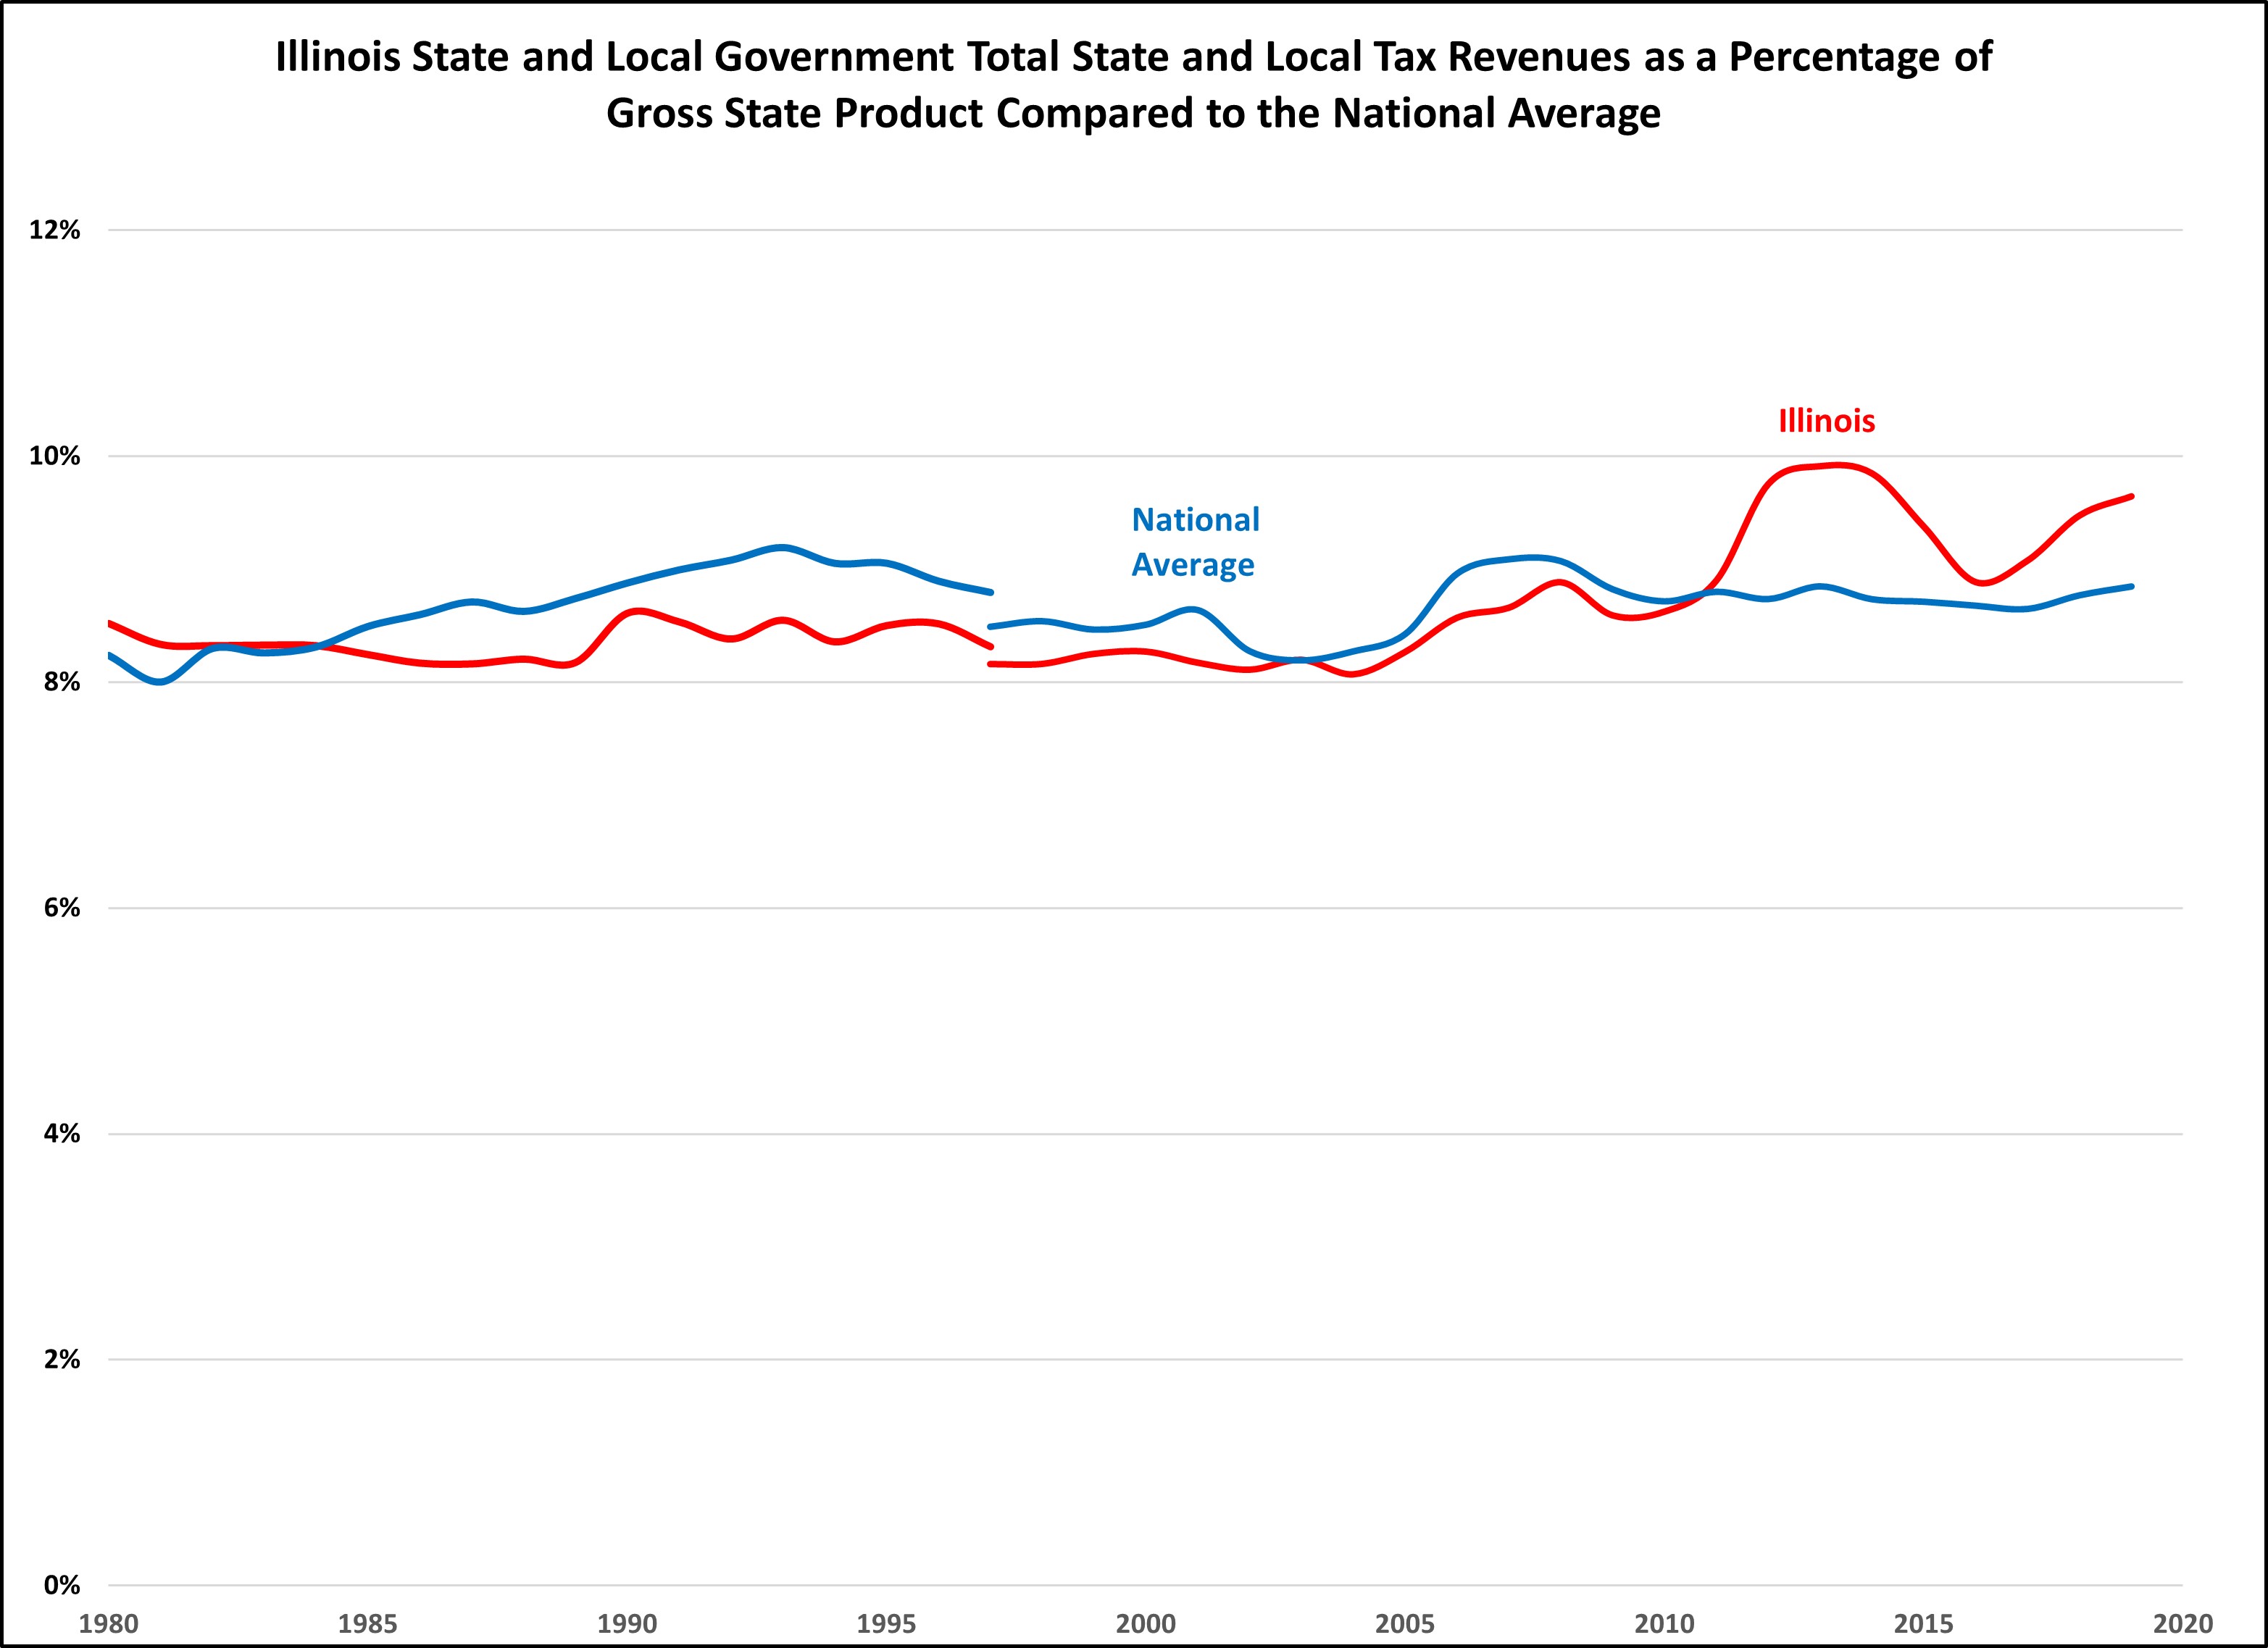
Historically, Illinois’ total state and local tax collections as a percentage of gross state product has been slightly below the national average. Taxes in Illinois increased in 2011 when income tax rates temporarily increased and came down when the income tax rate increase expired. In mid-2017, income tax rates were increased again, and the chart reflects the resulting changes in tax collections.
METHODOLOGY
Charts like these are only as good as the underlying data. The charts consistently rely on data from the United States Census Bureau, specifically, the Annual Survey of State and Local Finances. Some states have taxes which do not fit neatly into a category, such as Washington’s Business and Operations Tax, a gross receipts tax on businesses. Some might think it should be classified as a corporate income tax. However, the census classifies it as a sales and excise tax. There are other instances where the Census guidelines and classifications may not be intuitive, but for simplicity and consistency, we follow the Census classifications.
We are aware of flaws in the Census data. The sales tax data for Illinois was incorrect for approximately twenty years. For FY 2018 & FY 2019, there was a mistake with Illinois’ individual and corporate income tax data. The Census will update this figure but until then, we are using the corporate and individual income tax data from the Illinois Comptroller.
Additionally, the Census did not perform the State and Local Government Survey in 2001 and 2003 so data is unavailable for those years.
Despite these faults with the Census data, it is the best data source that exists to compare state and local government taxes.
Data from the Illinois Department of Revenue was obtained from their website or through a Freedom of Information request.
In 1997, the U.S. Bureau of Economic Analysis changed how gross domestic product and gross state product were calculated, resulting in a slightly higher value. This is why there is a break in the historical chart above.
* Maurice Scholten is Legislative Director of the Taxpayers’ Federation of Illinois.