
Tax Facts: An Illinois Chartbook – Overall State and Local Taxes – Maurice Scholten
Tax Facts: An Illinois Chartbook – Overall State and Local Taxes
February 2020 (73.2)
by Maurice Scholten*
People frequently ask how taxes in Illinois compare to other states. The answer to that question depends on who you ask. Advocates for increasing government spending present statistics that show Illinois as a low-tax state, while those who want a more limited role for government present statistics that show Illinois as a high-tax state. Tax Facts: An Illinois Chartbook, published last year by TFI, seeks to provide a true picture of where Illinois stands, and the following is an update of Chapter 2, a summary of Illinois’ overall tax landscape. In the coming months, we plan to update other chapters as well.
Two key points about how best to compare taxes between states:
- First, it is imperative to look at state and local taxes combined. There is little comfort for a citizen living in a state where the state government has low taxes, but local governments more than make up for it with high taxes. Furthermore, a person buying $100 worth of groceries and other household goods usually doesn’t know (or care) who imposed the sales tax on those goods or which government receives the tax.
- Secondly, tax collection rankings should reflect different economies in different states (which often have different costs of living and income levels). For example, let’s assume States A and B both have a flat income tax rate of 5%. However, in State A the average personal income is $40,000, and in State B the average personal income is $45,000. The average State A resident would pay $2,000 in income taxes and the average State B resident would pay $2,250. Even though the two states have the same rate, the State B resident pays more in absolute dollars, but she also has more after-tax income. Does State B have higher taxes, or are they equal? We would posit that they are equal. To reflect this properly, one can look at taxes as a percentage of the state’s personal income (the total of all their resident’s income from all sources) or of their gross state product (the total value of all goods and services produced within the State). One downfall of looking at taxes as a percentage of personal income is how they are sourced by the census bureau—the origin of the data used here, and in most similar studies. If an Illinois resident owns a restaurant in Indiana, the income associated with that restaurant is considered Illinois personal income. However, the revenue associated with that restaurant is sourced to Indiana for gross state product purposes, and typically it is Indiana collecting tax revenue from that business. While for some states, using one measure or the other doesn’t matter much, for others, it makes a significant difference. As a result, we use taxes as a percentage of gross state product to compare states to one another.
One last note: Rankings make good headlines, but it is more useful to determine if a state is an outlier and if so, by how much. For example, if a state has the highest taxes in the country but is only slightly higher than the national average, then that #1 ranking means very little, because all the states have essentially the same tax burden. On the other hand, if a state is ranked 10th but it is significantly above average, the fact that nine states have higher taxes doesn’t provide much comfort to that state’s citizens.
ILLINOIS TAXES ARE ABOVE AVERAGE
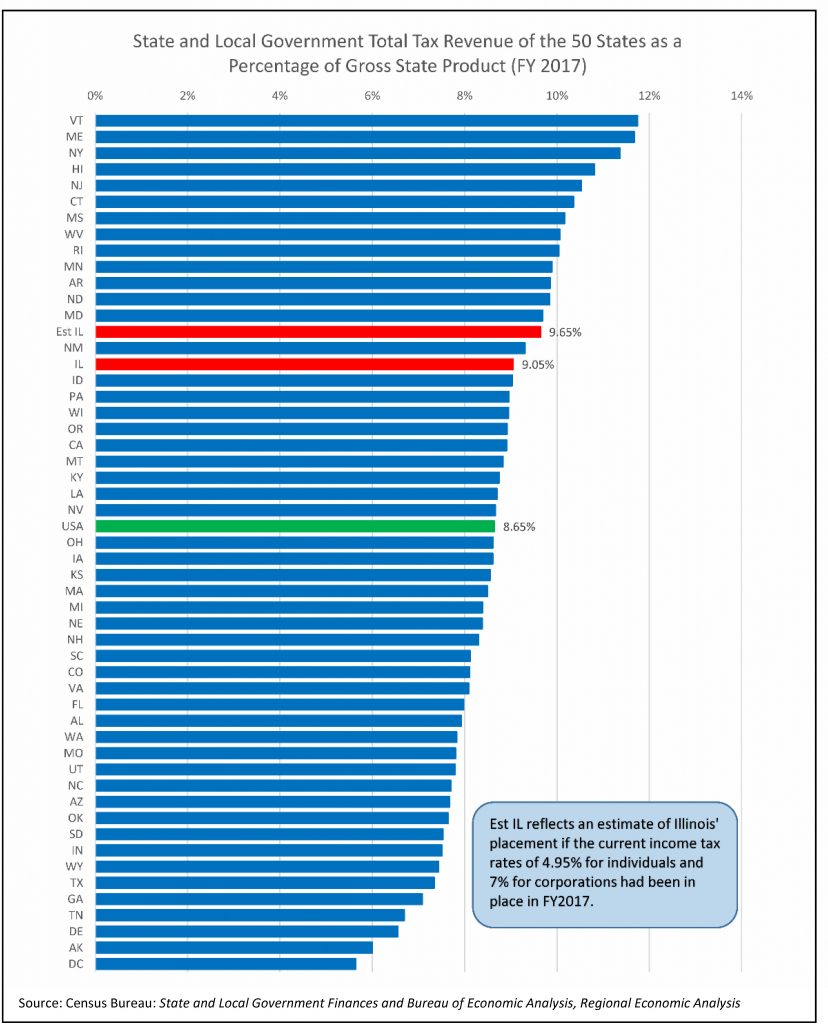
In FY2017, Illinois had the 15th highest total tax collections, at 9.05% of gross state product (Illinois collected $73.7 billion in state and local taxes). However, in FY2017, the individual income tax rate was 3.75%, while the current rate is 4.95%. The corporate rate was 5.25% rather than the current 7%, or, after including the Personal Property Replacement Income Tax, 7.75% then and 9.5% now. Assuming the higher rates had been in place in FY2017, Illinois would have risen to 14th place (and would have collected an estimated $78.5 billion).
If the higher rates in effect today had been in place in FY2017, Illinois’ tax collections would have been 11.6% above the national average.
PER CAPITA TAXES IN ILLINOIS ARE HIGH
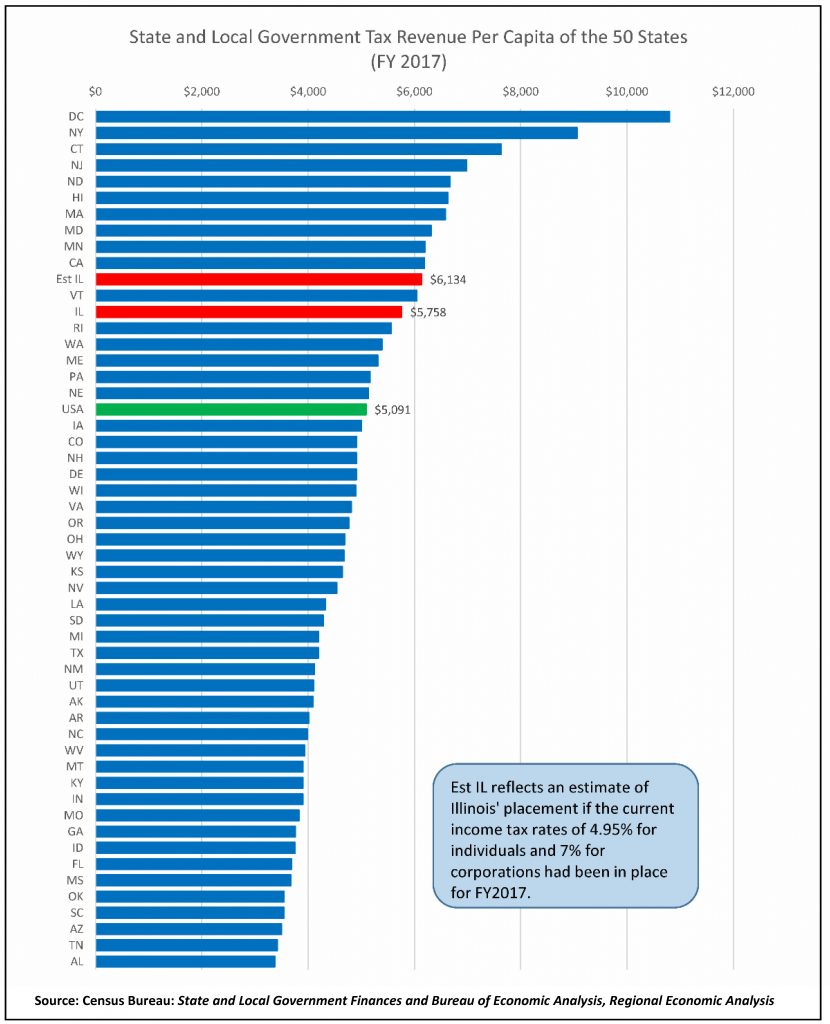
Per capita measurements fail to consider the different economies within the states, but they still have a purpose. When we say Illinois’ state and local taxes are at 9.05% of gross state product, most people don’t know what that means to them personally. Saying that Illinois’ state and local tax burden is $5,758 per person, on the other hand, is easier to understand (even though some people pay less than this and others pay more). The average per capita state and local tax collection is $5,091, but Illinois collected $5,758 per person in FY2017. If the income tax rates had been at their current levels, Illinois would have generated $6,134 per person, or 20.5% above the national average.
Once again, different numbers looking at the same thing– taxes in Illinois– paint two similar but different pictures. Measuring total state and local taxes paid both on a per capita basis and as a percentage of gross state product show that Illinois governments collect more taxes than average, but using one measurement (gross state product) Illinois is 11.6% above average, while the other measurement (per capita) shows Illinois is 20.5% above average. This is a significant difference: using per capita figures, Illinois’ taxes are $13.4 billion above average, but only $8.1 billion above average using the gross state product method.
ILLINOIS OWN SOURCE REVENUES TELL A DIFFERENT STORY
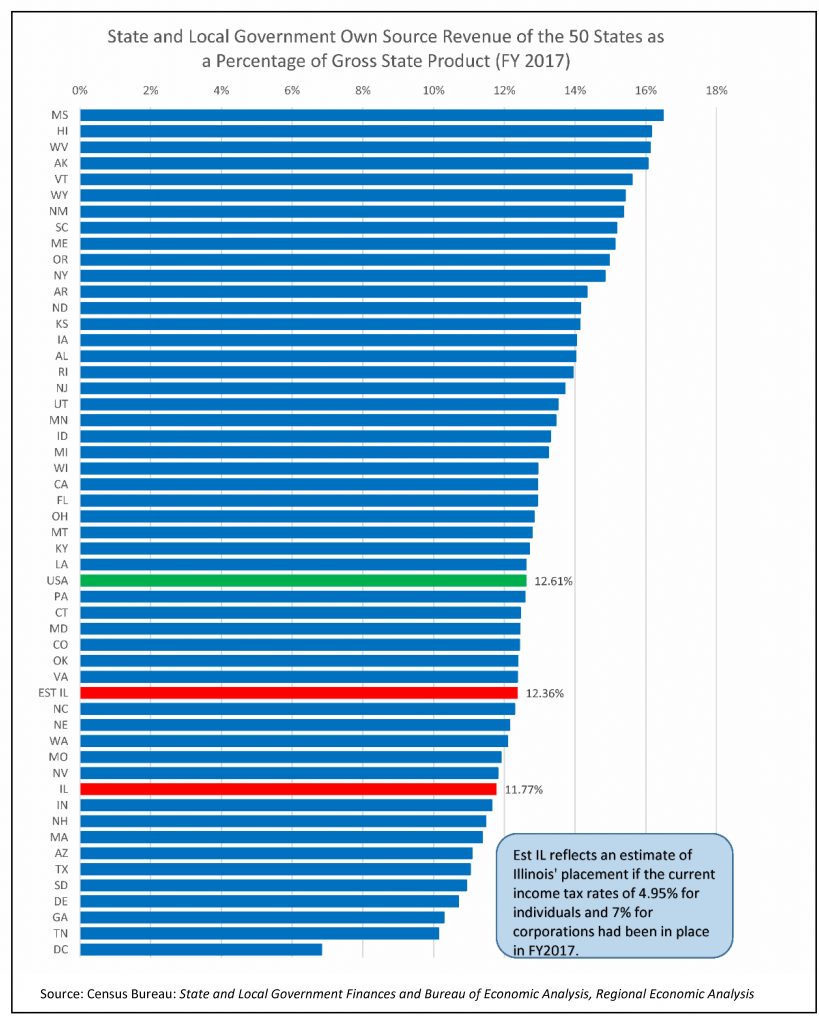
So far, we have looked at Illinois’ total tax collections, which includes income taxes, sales taxes, property taxes, excise taxes, utility taxes, and other miscellaneous taxes. It does not include other revenues that state and local governments receive, such as fines, fees, college tuition, tolls, and other similar revenues. One can argue that a more inclusive figure (commonly called own-source revenue) is a better measuring stick, since a person doesn’t care if a payment they make to a government is a fee or a tax–it is still going to the government. However, most fees are for a specified service (or should be), such as parents paying a sports fee for their child to play soccer in high school or a driver paying a toll to use a certain highway. And the revenues from these fees are generally used to fund that specific service (the soccer team or highway), rather than for general government purposes. Despite these misgivings, it is important to look at this more inclusive figure, which shows that Illinois is below the national average, even when the 2017 income tax increase is factored in.
This is a surprise—tax revenues are above average, according to the chart on page 2, but total own-source revenues are below average. What Illinois fees or non-tax revenue sources are below the national average and offset our above average taxes? This figure does not include revenues from government run utilities and liquor stores, but one area where Illinois collects significantly less than the national average is hospital revenue: Illinois collects $142 per capita while the national average is $496 per capita. Nationally, 18.5% of hospitals are run by state and local governments. In Illinois, that figure is 12.2%, which explains why we collect below the average amount. If Illinois were at the national average, we would collect an additional $4.54 billion in hospital revenue. However, governments that collect hospital revenue need to provide medical care in exchange. If Illinois wanted to increase the hospital revenue figure, our state and local governments would also have to increase the number of, and amount of expenditures on, government hospitals. Increasing hospital revenues would not guarantee any additional funding for other state functions or otherwise alleviate Illinois’ tax burden.
While this own-source revenue number may be useful for some purposes, understanding it requires looking at what is driving the difference: where is Illinois significantly below average, and where are we significantly above average.
REMOVING HOSPITAL REVENUE RAISES ILLINOIS’ RANKING
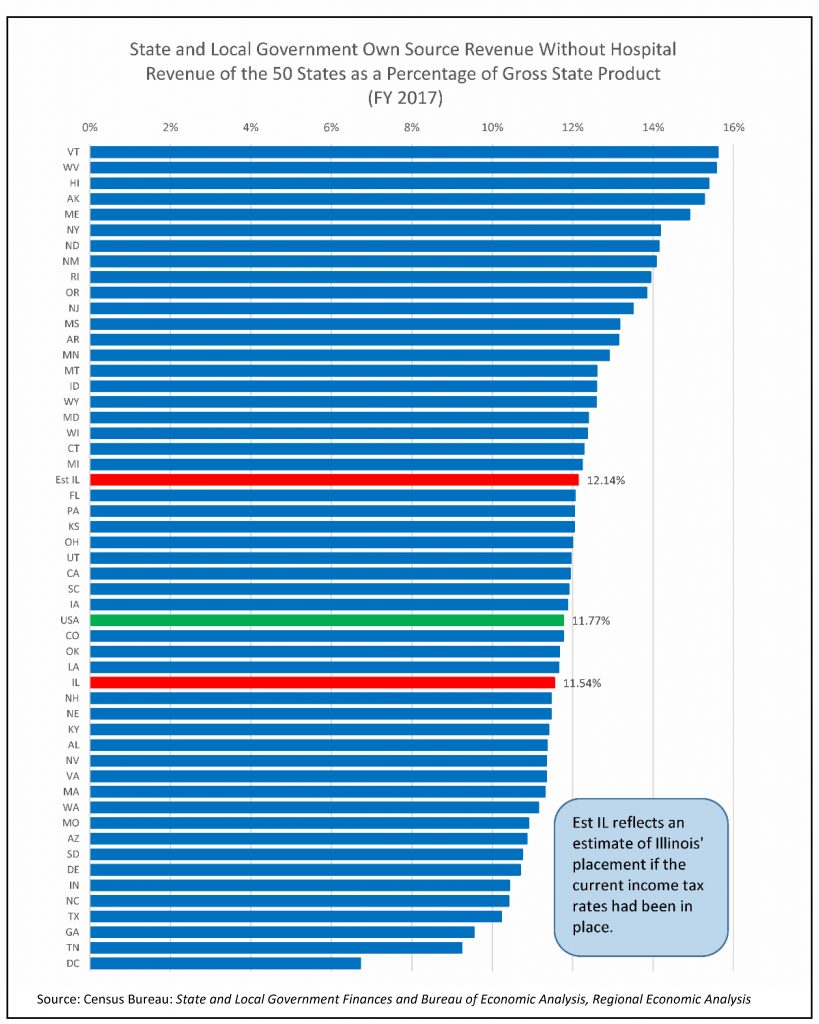
When government hospital revenue is removed from the own-source revenue data, Illinois’ ranking increases. In FY2017, Illinois was still below average, but after factoring in the estimated impact of the 2017 income tax rate increase, Illinois moves to above average, meaning Illinois is not much of an outlier.
UNTIL RECENTLY, ILLINOIS TAXES HAVE BEEN BELOW AVERAGE
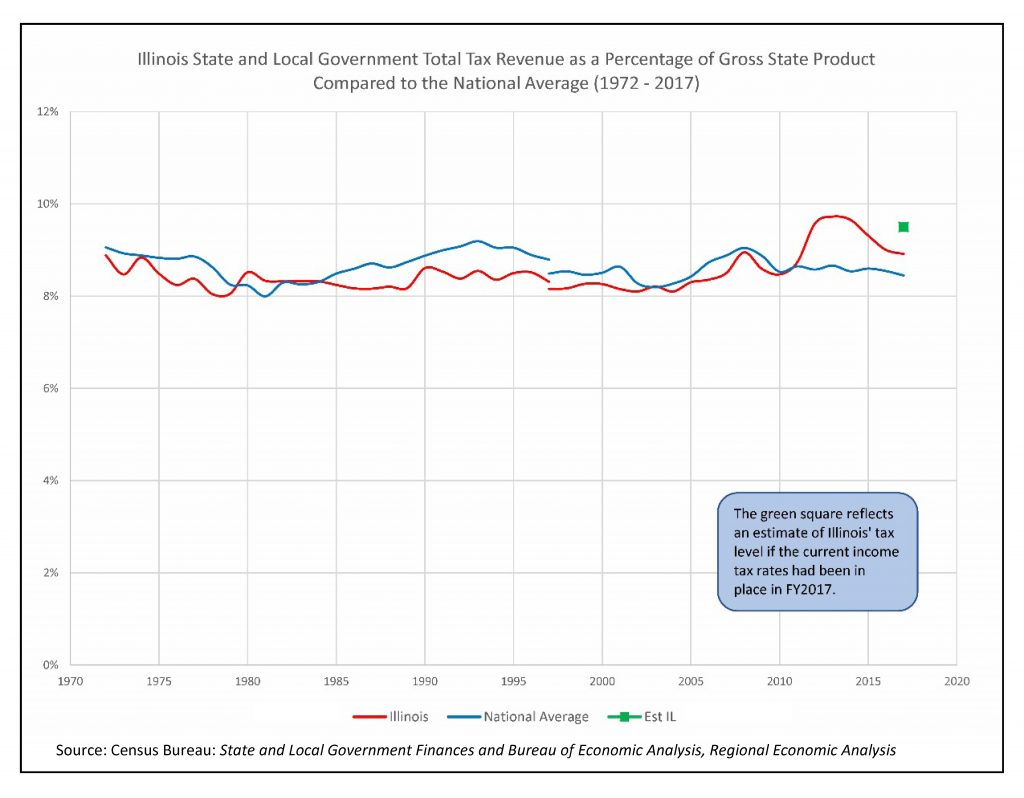
Historically, Illinois’ total state and local tax collections as a percentage of gross state product had been slightly below the national average. Taxes in Illinois increased in 2011 when income tax rates temporarily increased and came down when the income tax rate increase expired. In mid-2017, income tax rates were increased again. The green point on the chart shows Illinois’ estimated tax collections if those higher income tax rates had been in place in FY2017. We can expect the Illinois line to start trending up in FY2018 as that is the first year where the data reflects the increased income tax rates.
*Maurice Scholten is the Legislative Director of the Taxpayers’ Federation of Illinois.