Sales & Excise Taxes – How Does Illinois Compare?
Sales & Excise Taxes – How Does Illinois Compare?
March 2022 (75.3)
by Maurice Scholten*
People frequently ask how taxes in Illinois compare to those in other states. The answer to that question depends on who you ask. Advocates for increasing government spending present statistics that show Illinois as a low-tax state, while those who want a more limited role for government present statistics that show Illinois as a high-tax state. We are releasing a series of Tax Facts articles attempting to provide a true picture of where Illinois stands. We first looked at the overall tax climate in Illinois, and then income taxes. We now turn to sales and excise taxes.
Two key points about how we undertake this comparison of state taxes:
- First, it is imperative to look at state and local taxes combined. Some states pay for services with state funds, while others leave that funding to local governments and local taxes. Furthermore, a person buying $100 worth of groceries and other household goods usually does not know (or care) who imposed the sales tax on those goods, and which government receives the tax.
- Secondly, we contend that tax collection rankings should reflect different economies in different states (which often reflect different costs of living and income levels).
For example, let’s assume States A and B both have a flat income tax rate of 5%, but in State A the median personal income is $50,000, and in State B the median personal income is $55,000. As a result, the median State A resident would pay $2,500 in income taxes and the median State B resident would pay $2,750. Even though the two states have the same rate, the State B resident pays more in absolute dollars, but she also has more after-tax income. Does State B have higher taxes, or are they equal? We would posit that they are equal, so a per capita comparison would not adequately capture the differences between State A and B. To reflect this properly, we look at taxes as a percentage of gross state product (the total value of all goods and services produced within the State) to arrive at the percentage of economic output diverted to taxes.
Finally, in terms of presentation, rankings make good headlines, but the bar graphs we use make it easier to visualize if a state is an outlier, and if so by how much. For example, if a state has the highest taxes in the country but is only slightly higher than the national average, then that #1 ranking means very little, because all the states have essentially the same tax burden. On the other hand, if a state is ranked 10th but it is significantly above average, the fact that nine states have higher taxes does not provide much comfort to that state’s citizens.
We use the most recent data that the Census Bureau has released, which is for FY 2019. This data predates COVID-19 which has had a significant impact on everything, including state and local taxes. We will update these charts when the Census Bureau releases updated data.
Sales Taxes
Illinois first enacted a sales tax (called then, and now, the “Retailers’ Occupation Tax”) in 1933. A corresponding Use Tax was enacted in 1955, followed by Service Occupation and Service Use Taxes (imposed on goods transferred when providing services, not on the services themselves) in 1961. Various local governments are also authorized to impose sales (also called occupation) taxes, and many do. These taxes are added onto the state tax and collected at the same time. Collectively, these taxes are referred to as sales taxes.
Excise Taxes
Illinois also imposes a number of excise taxes. An excise tax is also a transaction-based tax but is imposed on a specific good or service and can be measured as a percentage of the selling price, or based on the weight, volume, or other measurement of the good. Excise taxes can be imposed, collected, and administered either locally or at the state level.
Local Sales Taxes
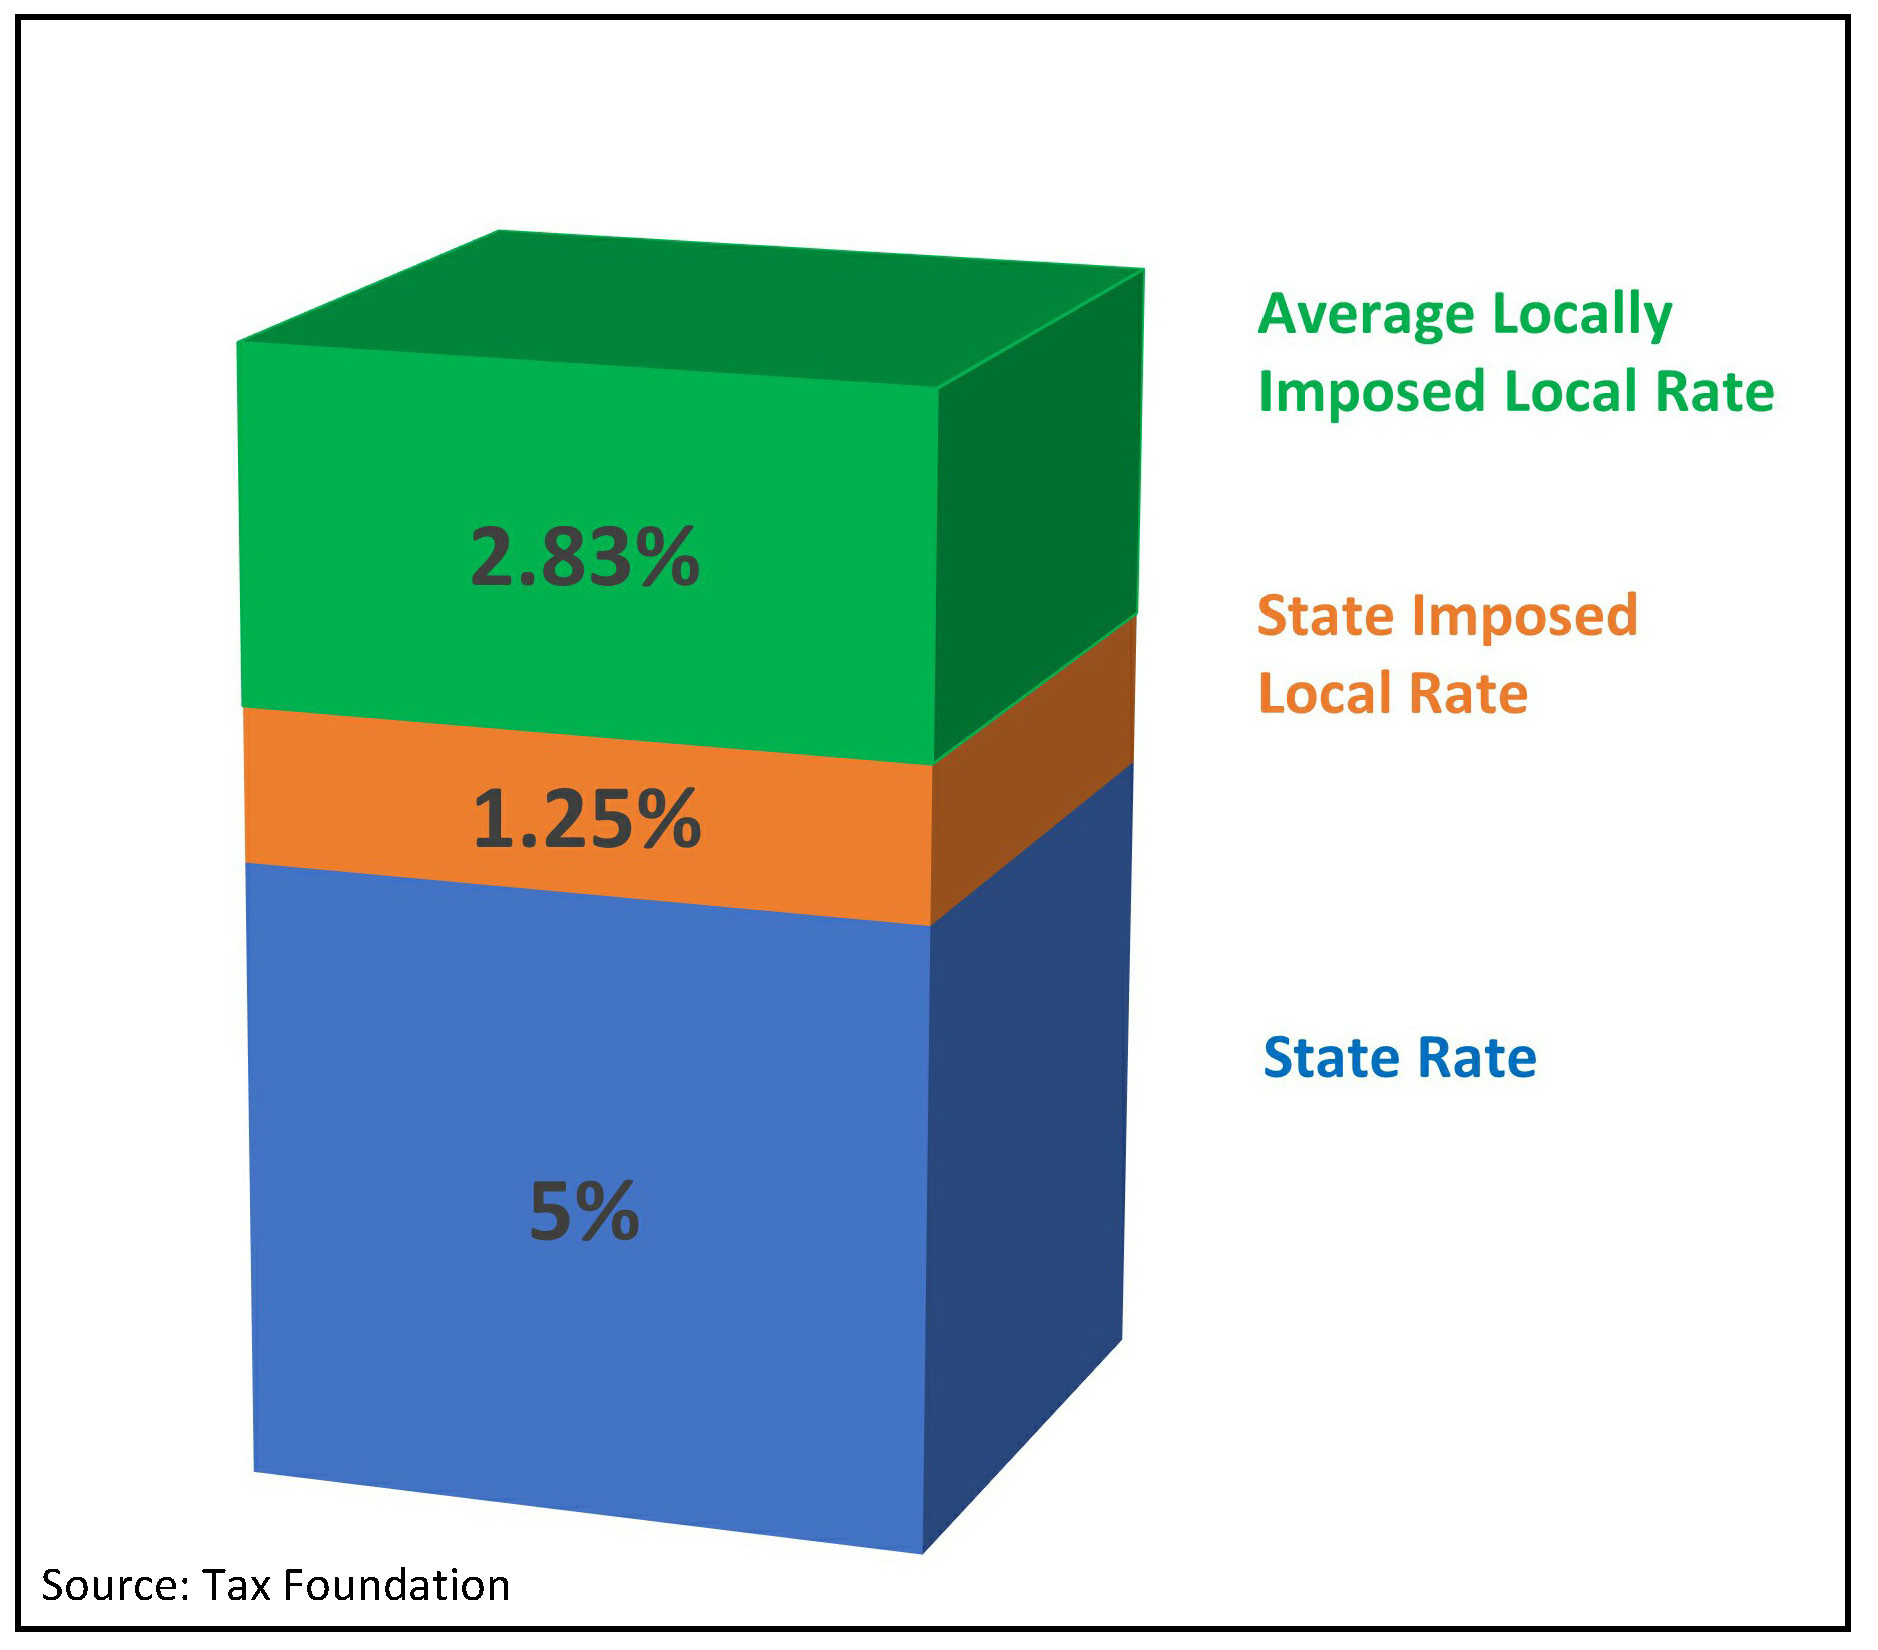
Illinois has a general sales tax rate of 6.25%. Some local governments are able to enact local sales taxes that are collected by the State and the consumer just sees a single sales tax rate.
Sale Tax Rate Breakdown
The Tax Foundation has calculated that Illinois’ population-weighted average combined state and local sales tax rate on general merchandise is 9.08% as of January 1, 2020, and this was commonly reported as a state rate of 6.25% and an average local rate of 2.83%. It should be noted that the state government only retains 5.00% of the 6.25% “state rate” and the remaining 1.25% is distributed to local governments as if they had imposed the tax. When all is said and done, on an average sale, 45% of the tax goes to local governments and 55% goes to the State.
ILLINOIS’ SALES AND EXCISE TAXES ARE SLIGHTLY BELOW AVERAGE
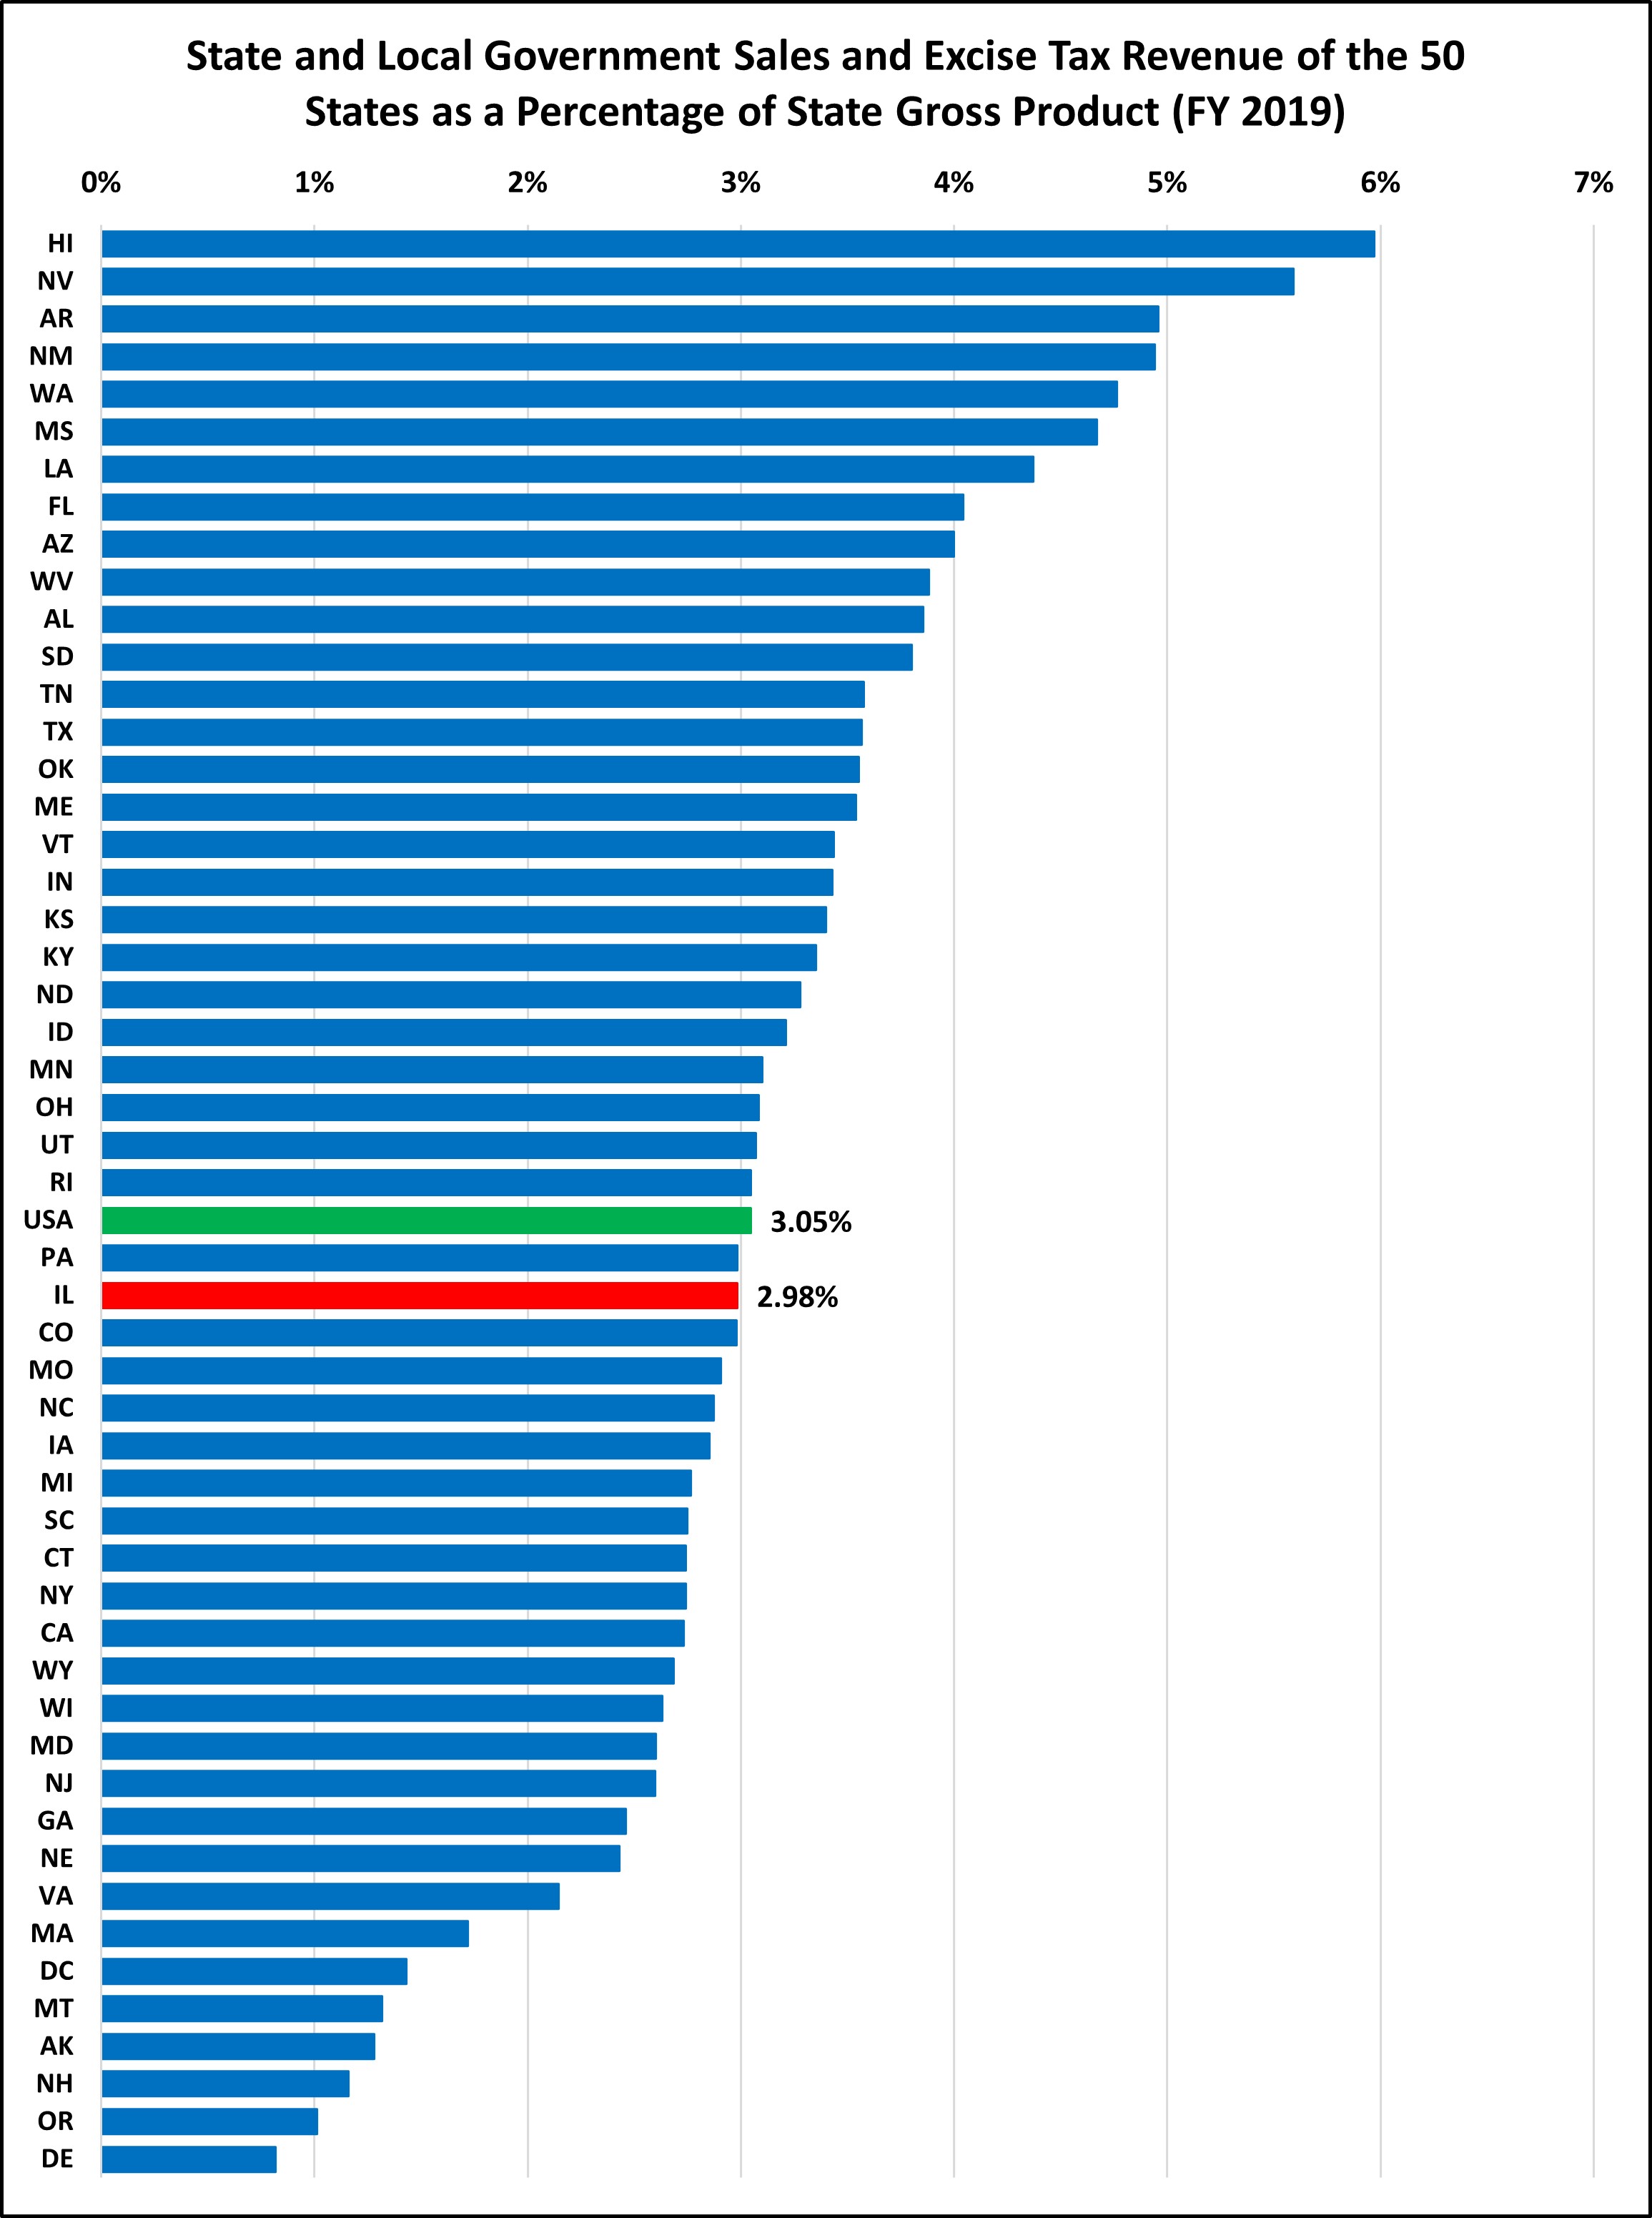
Looking at sales and excise taxes together provides a more accurate state-to-state comparison than looking at either tax category alone. In some states, hotel stays are subject to an excise tax, but other states include these charges in their sales tax base. This is true with other items as well, such as amusement taxes, utility taxes, and automobile renting taxes. Also included in this category are gross receipts taxes, such as Texas’ margin tax and Washington’s Business and Occupation Tax (which are generally considered more like an income tax).
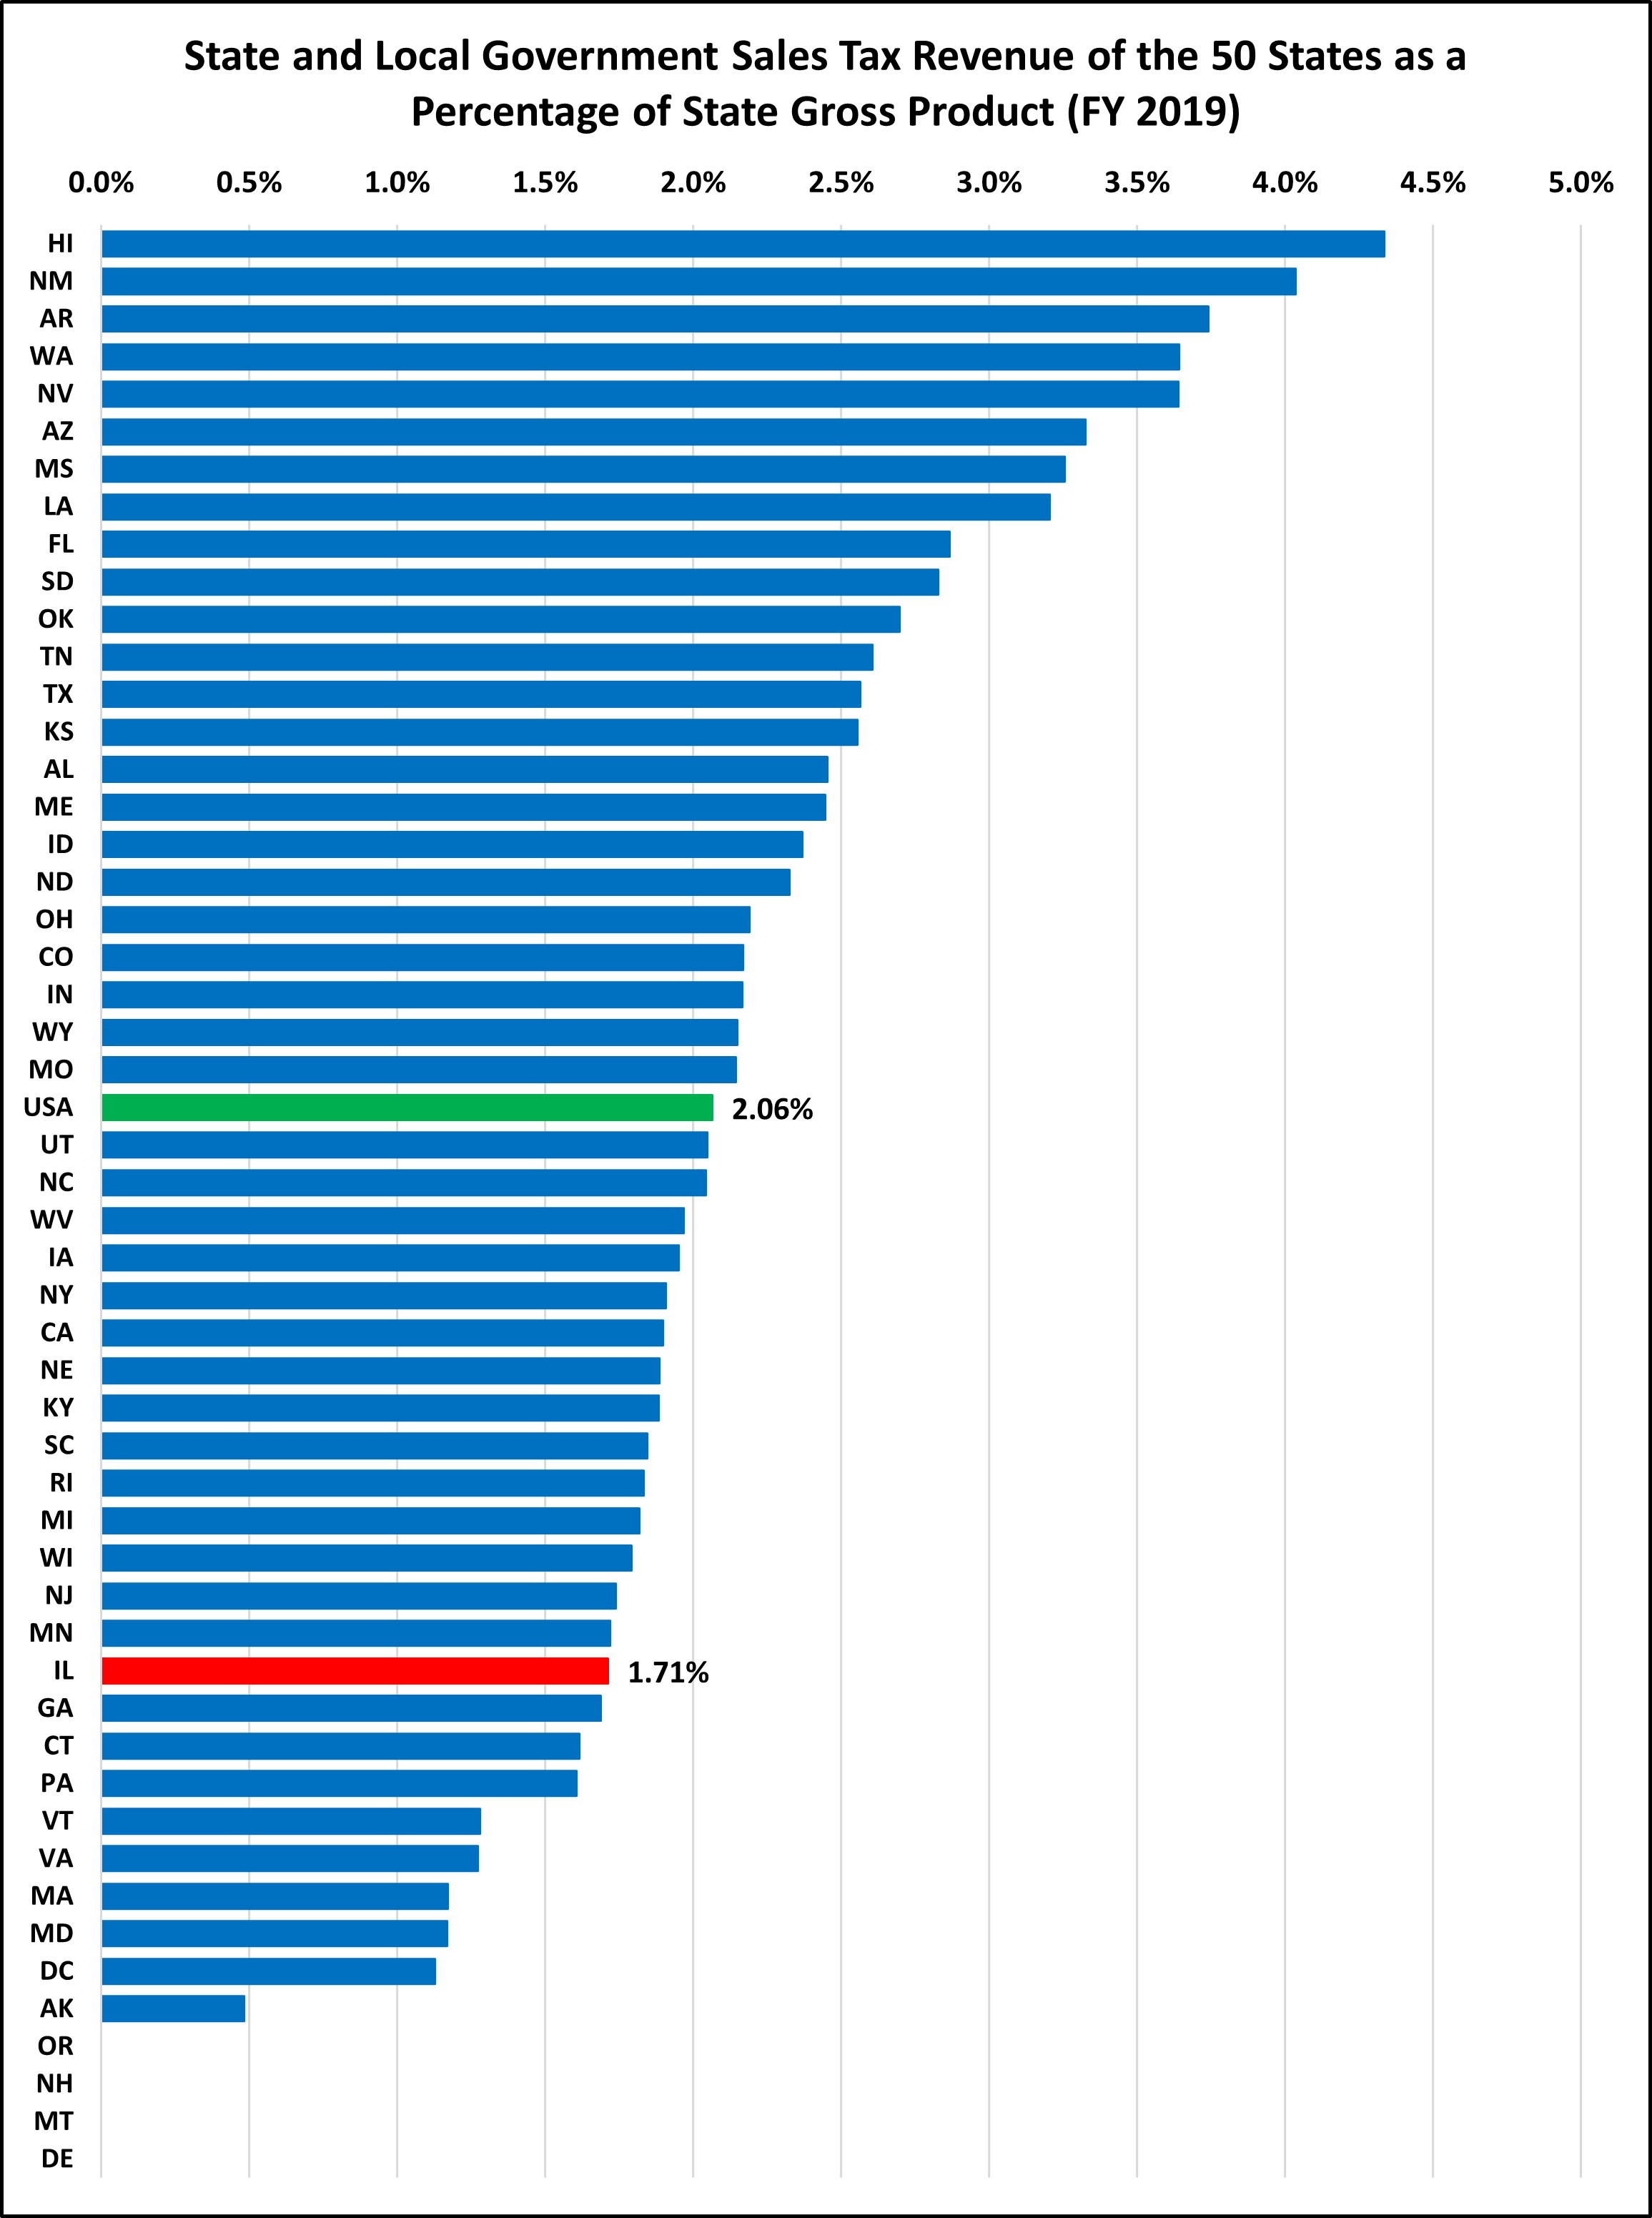
ILLINOIS’ SALES TAX RATE IS HIGH
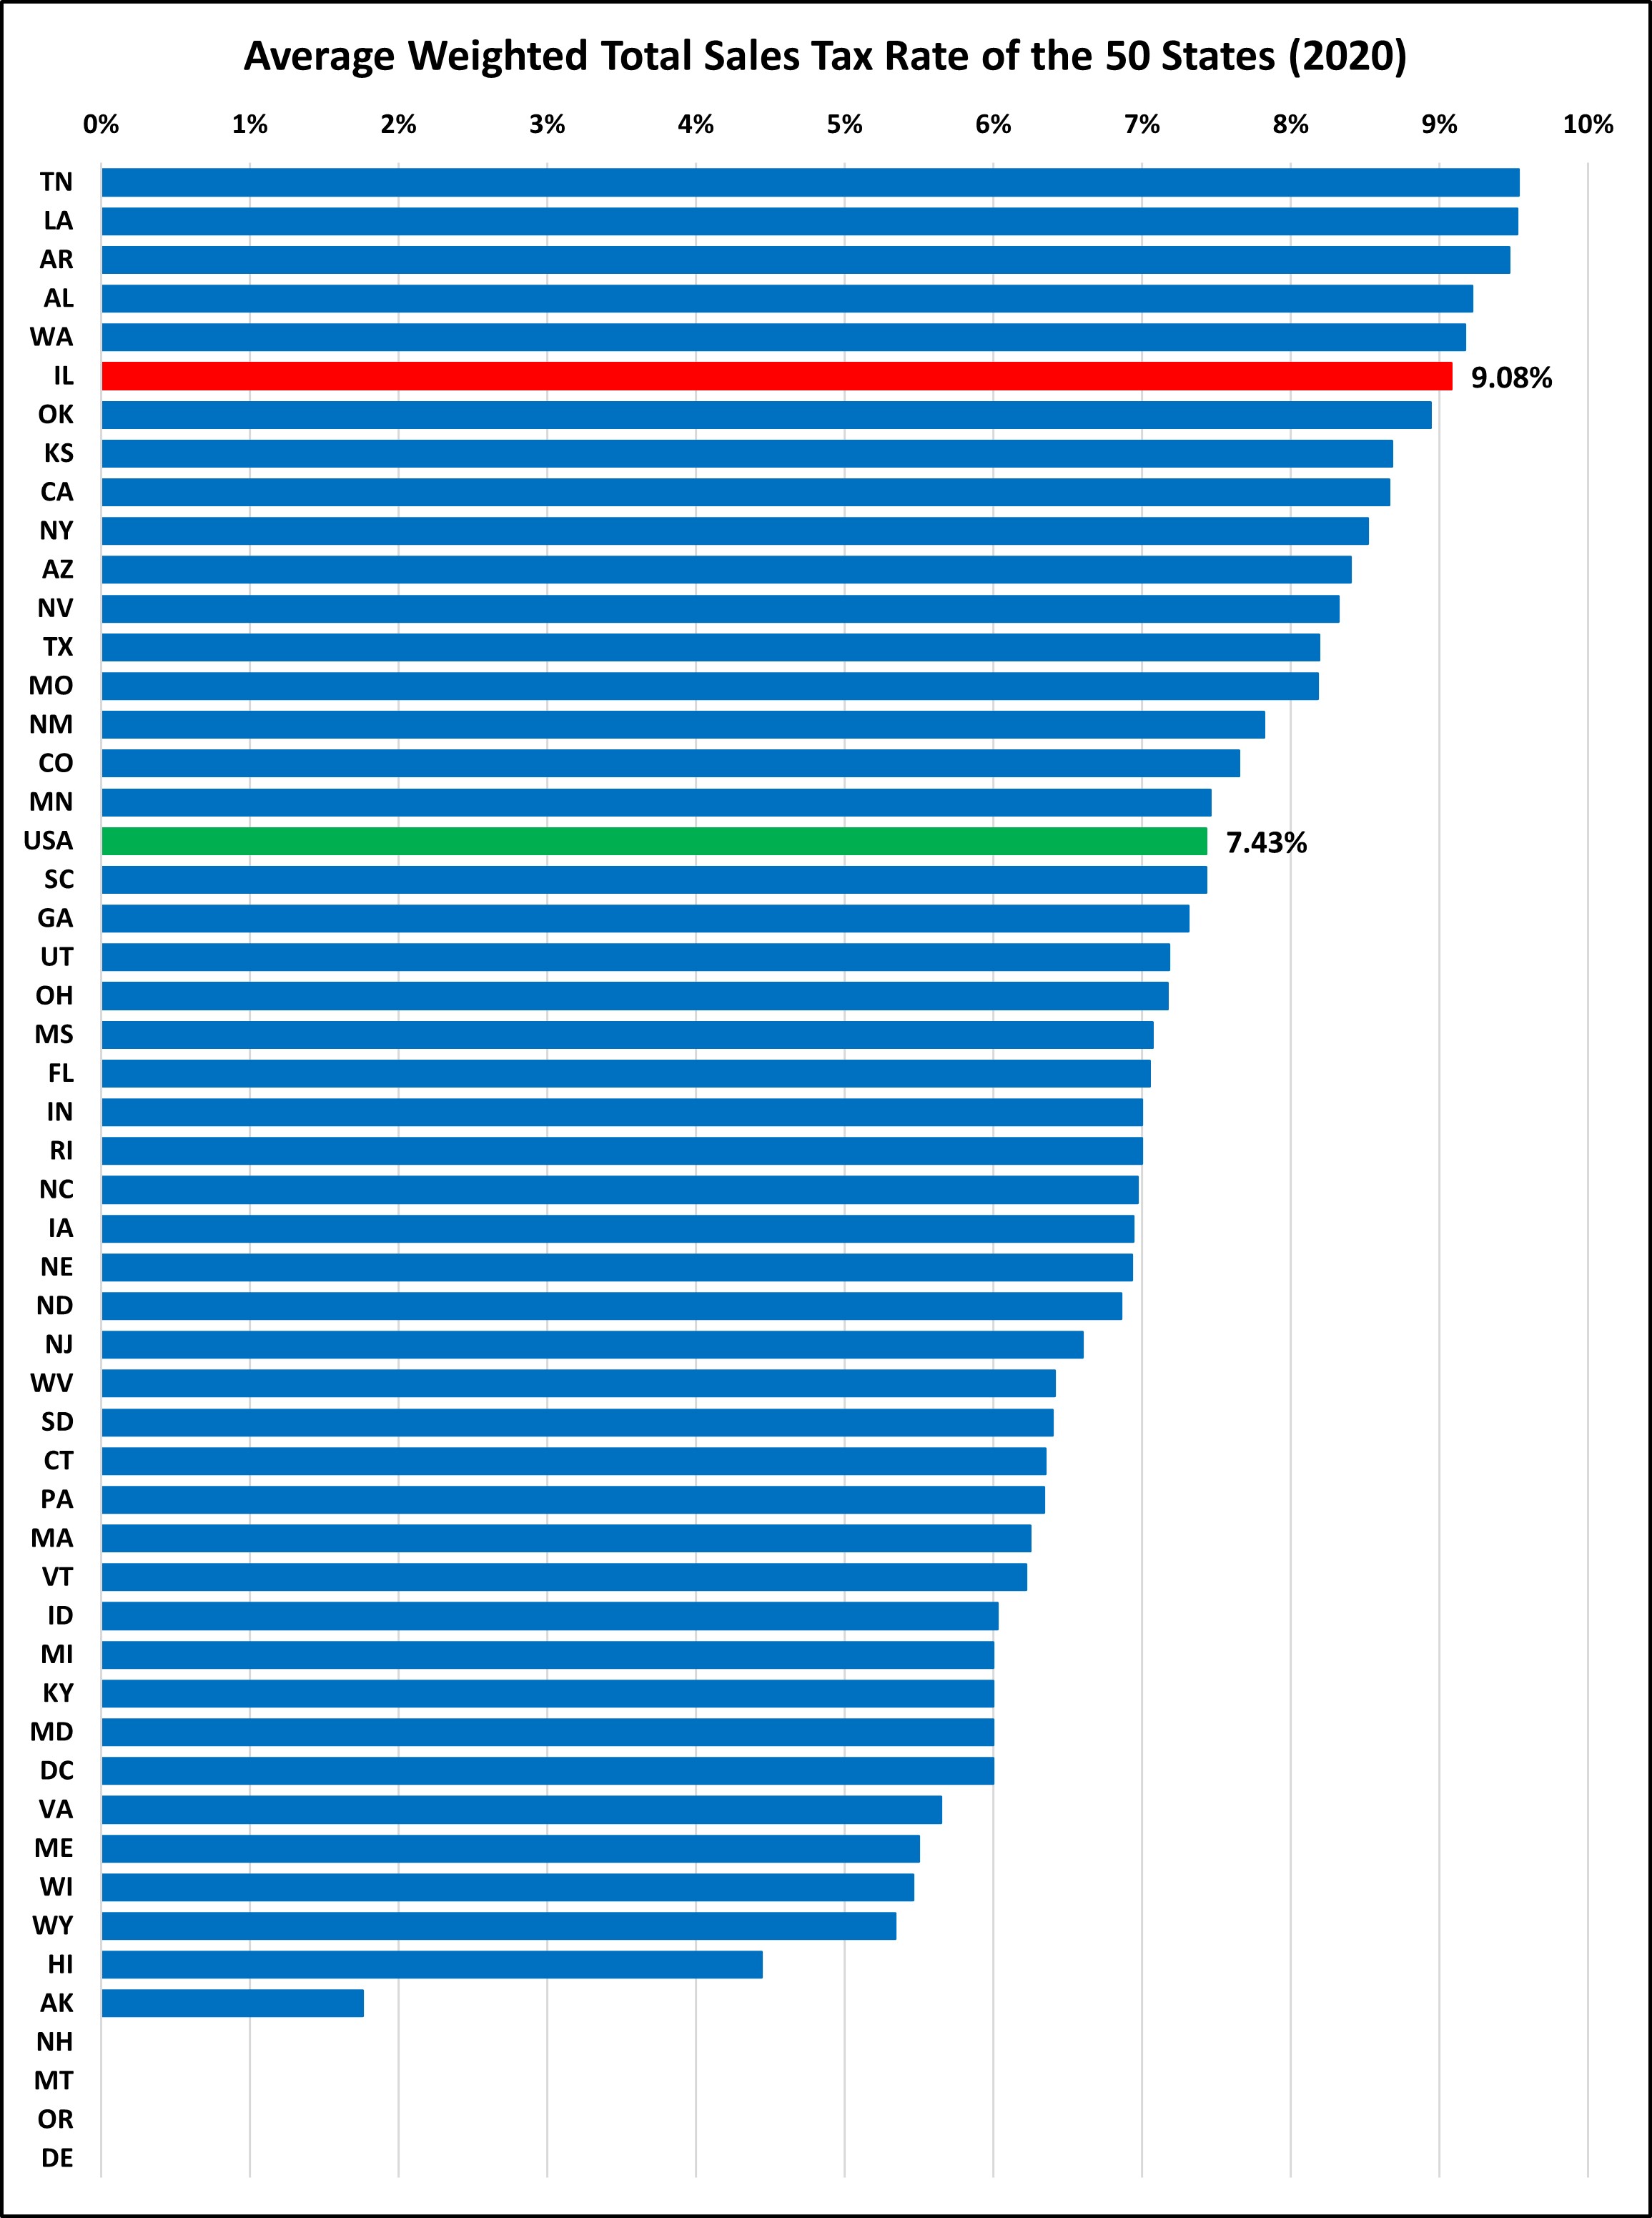
Illinois’ average sales tax rate is 22% above the national average. However, Illinois’ sales tax collections are 17% below average. On its face, it seems that one of these charts must be wrong. But this discrepancy is real and is most likely due to Illinois having a narrower-than-average tax base. For example, Illinois generally does not tax services with its sales tax, but that is not the whole story: it imposes a number of excise taxes on services.
ILLINOIS’ SALES TAX COLLECTIONS ARE BELOW AVERAGE
Two additional points to consider:
- Gross receipts taxes are included in these collection numbers. This makes direct comparisons a little more difficult, because taxes like the Texas margin tax are more commonly considered analogous to the corporate income tax.
- In June of 2018, the U.S. Supreme Court allowed states to require out of state retailers to collect their sales tax. Illinois and other states have made changes to take advantage of this decision. FY 2019 is the first year to reflect this change.
ILLINOIS EXCISE TAX COLLECTIONS ARE ABOVE AVERAGE
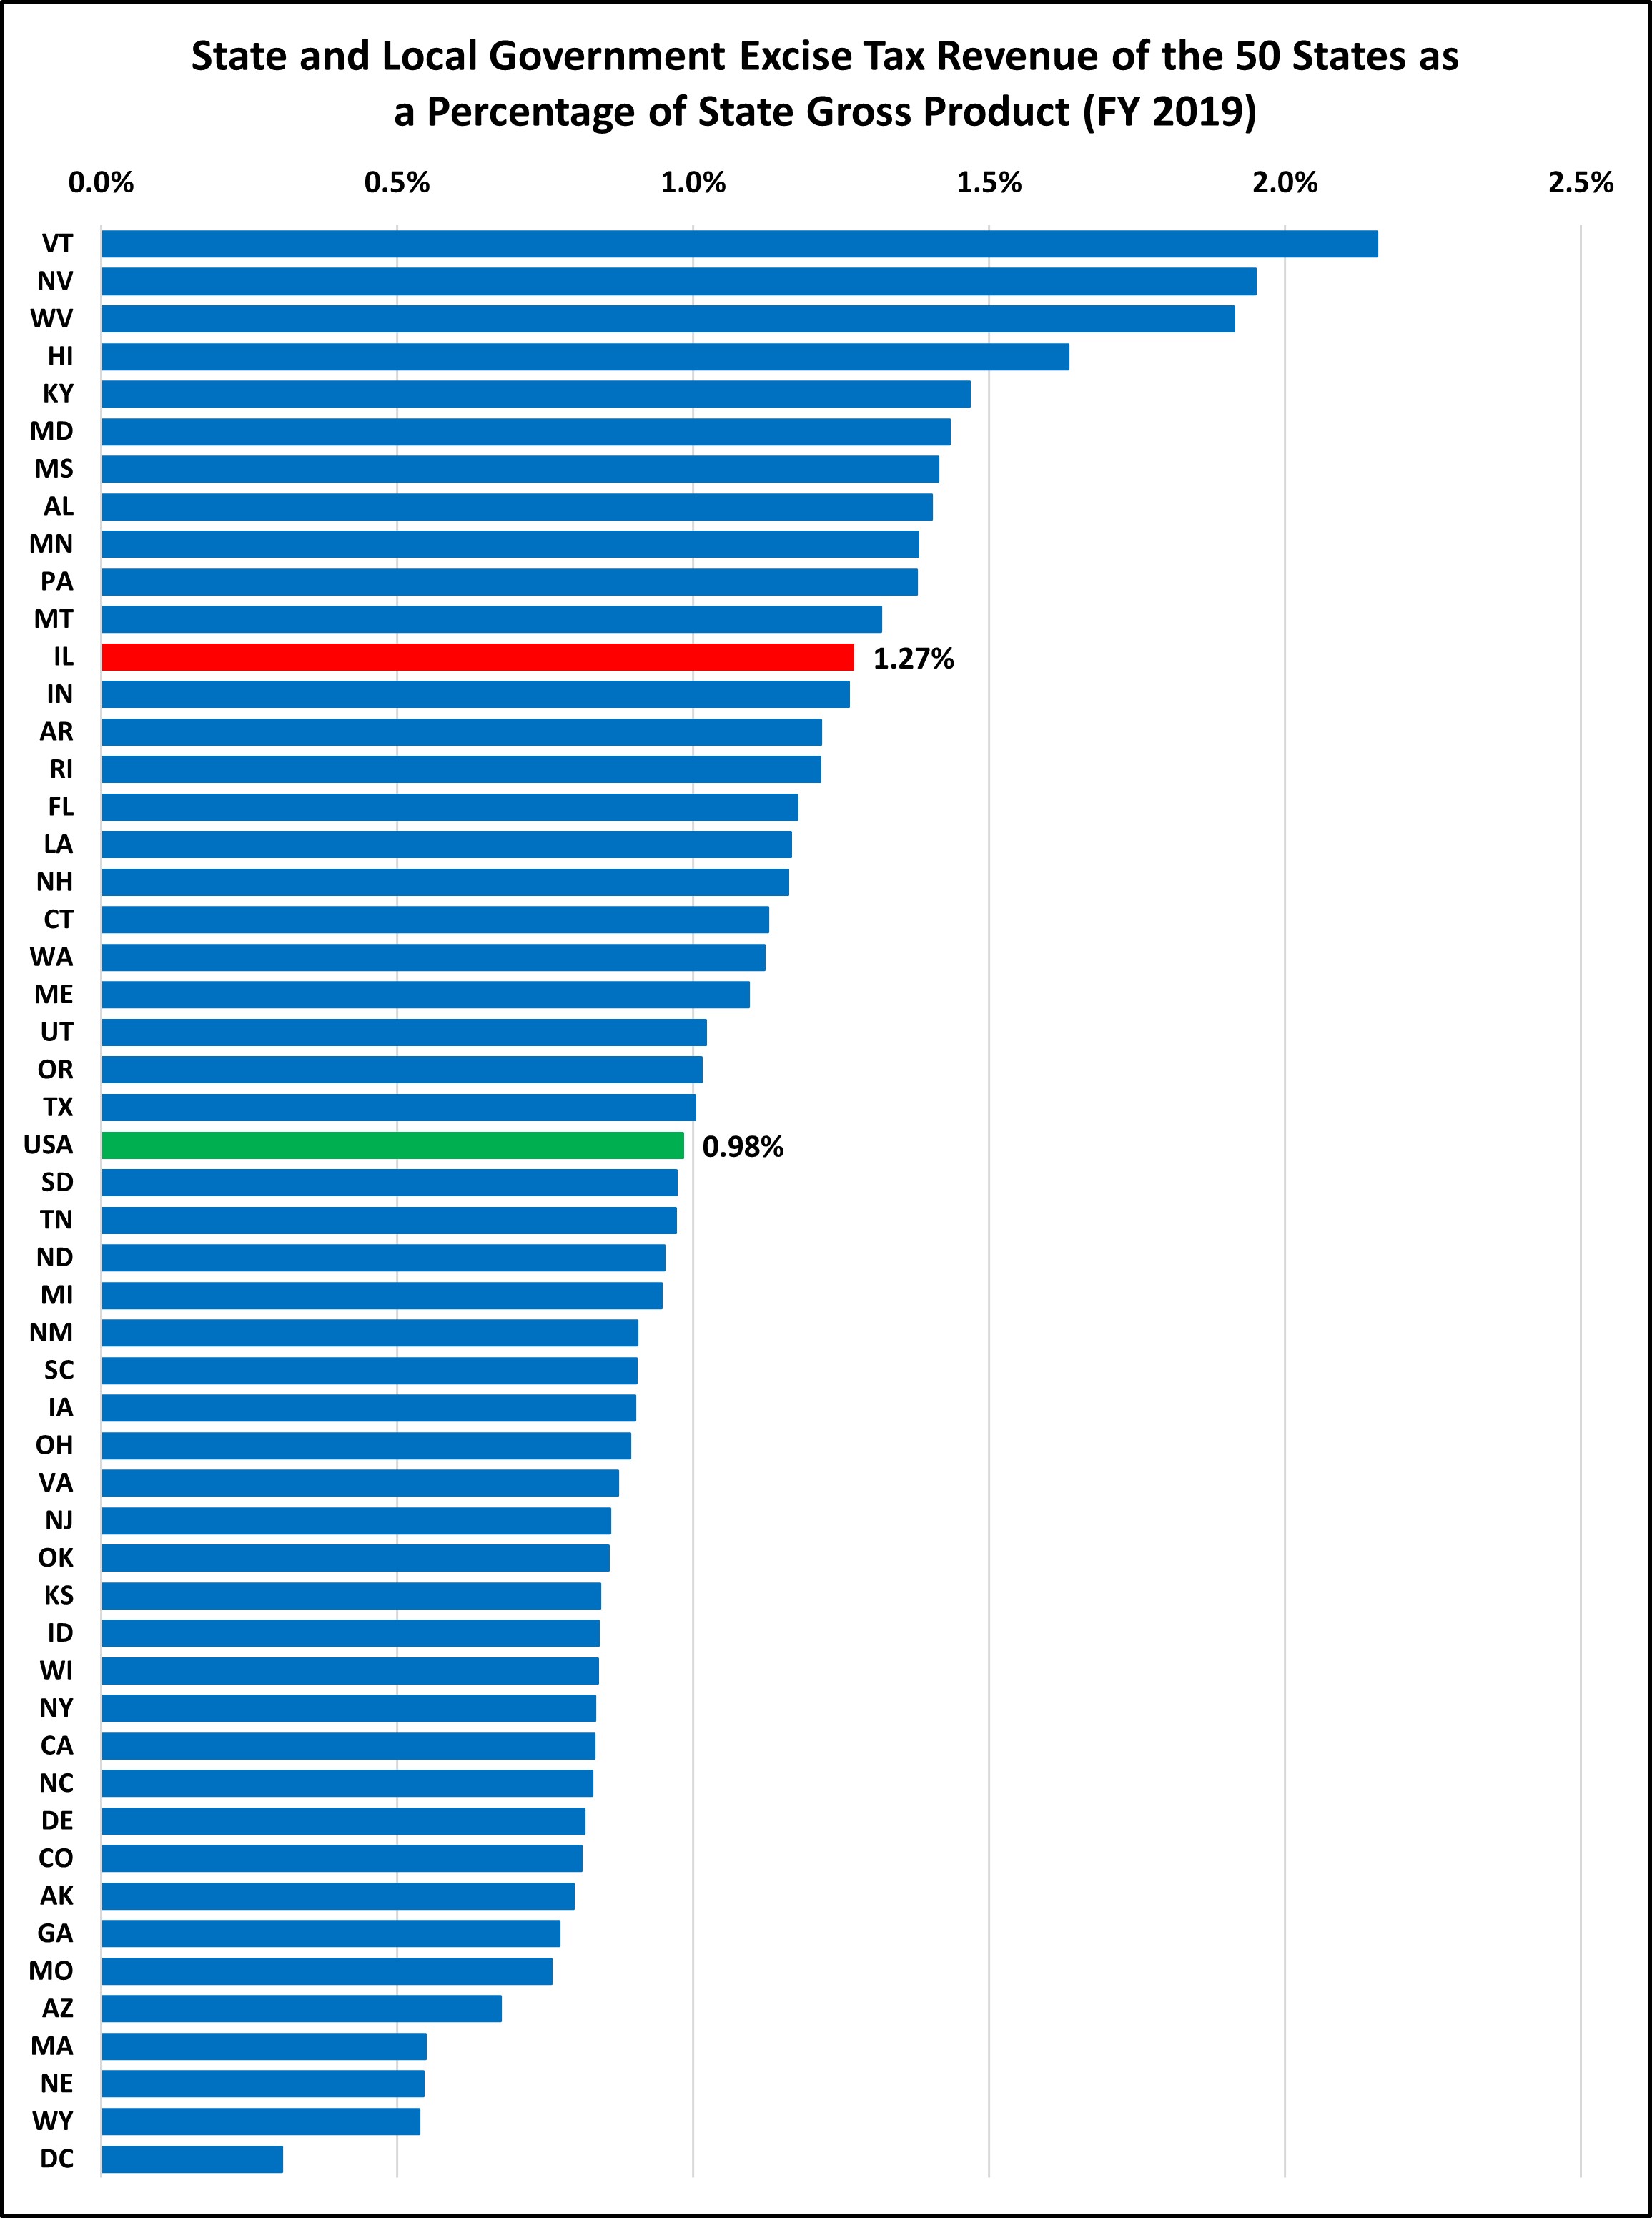
Illinois may have below average sales tax collections, but its excise collections are above average. This includes taxes on electricity, natural gas, hotels, car rentals, amusements, parking, motor fuel, alcohol, tobacco, and telecommunications, among others.
HISTORICALLY, ILLINOIS’ SALES & EXCISE TAXES HAVE BEEN NEAR THE NATIONAL AVERAGE
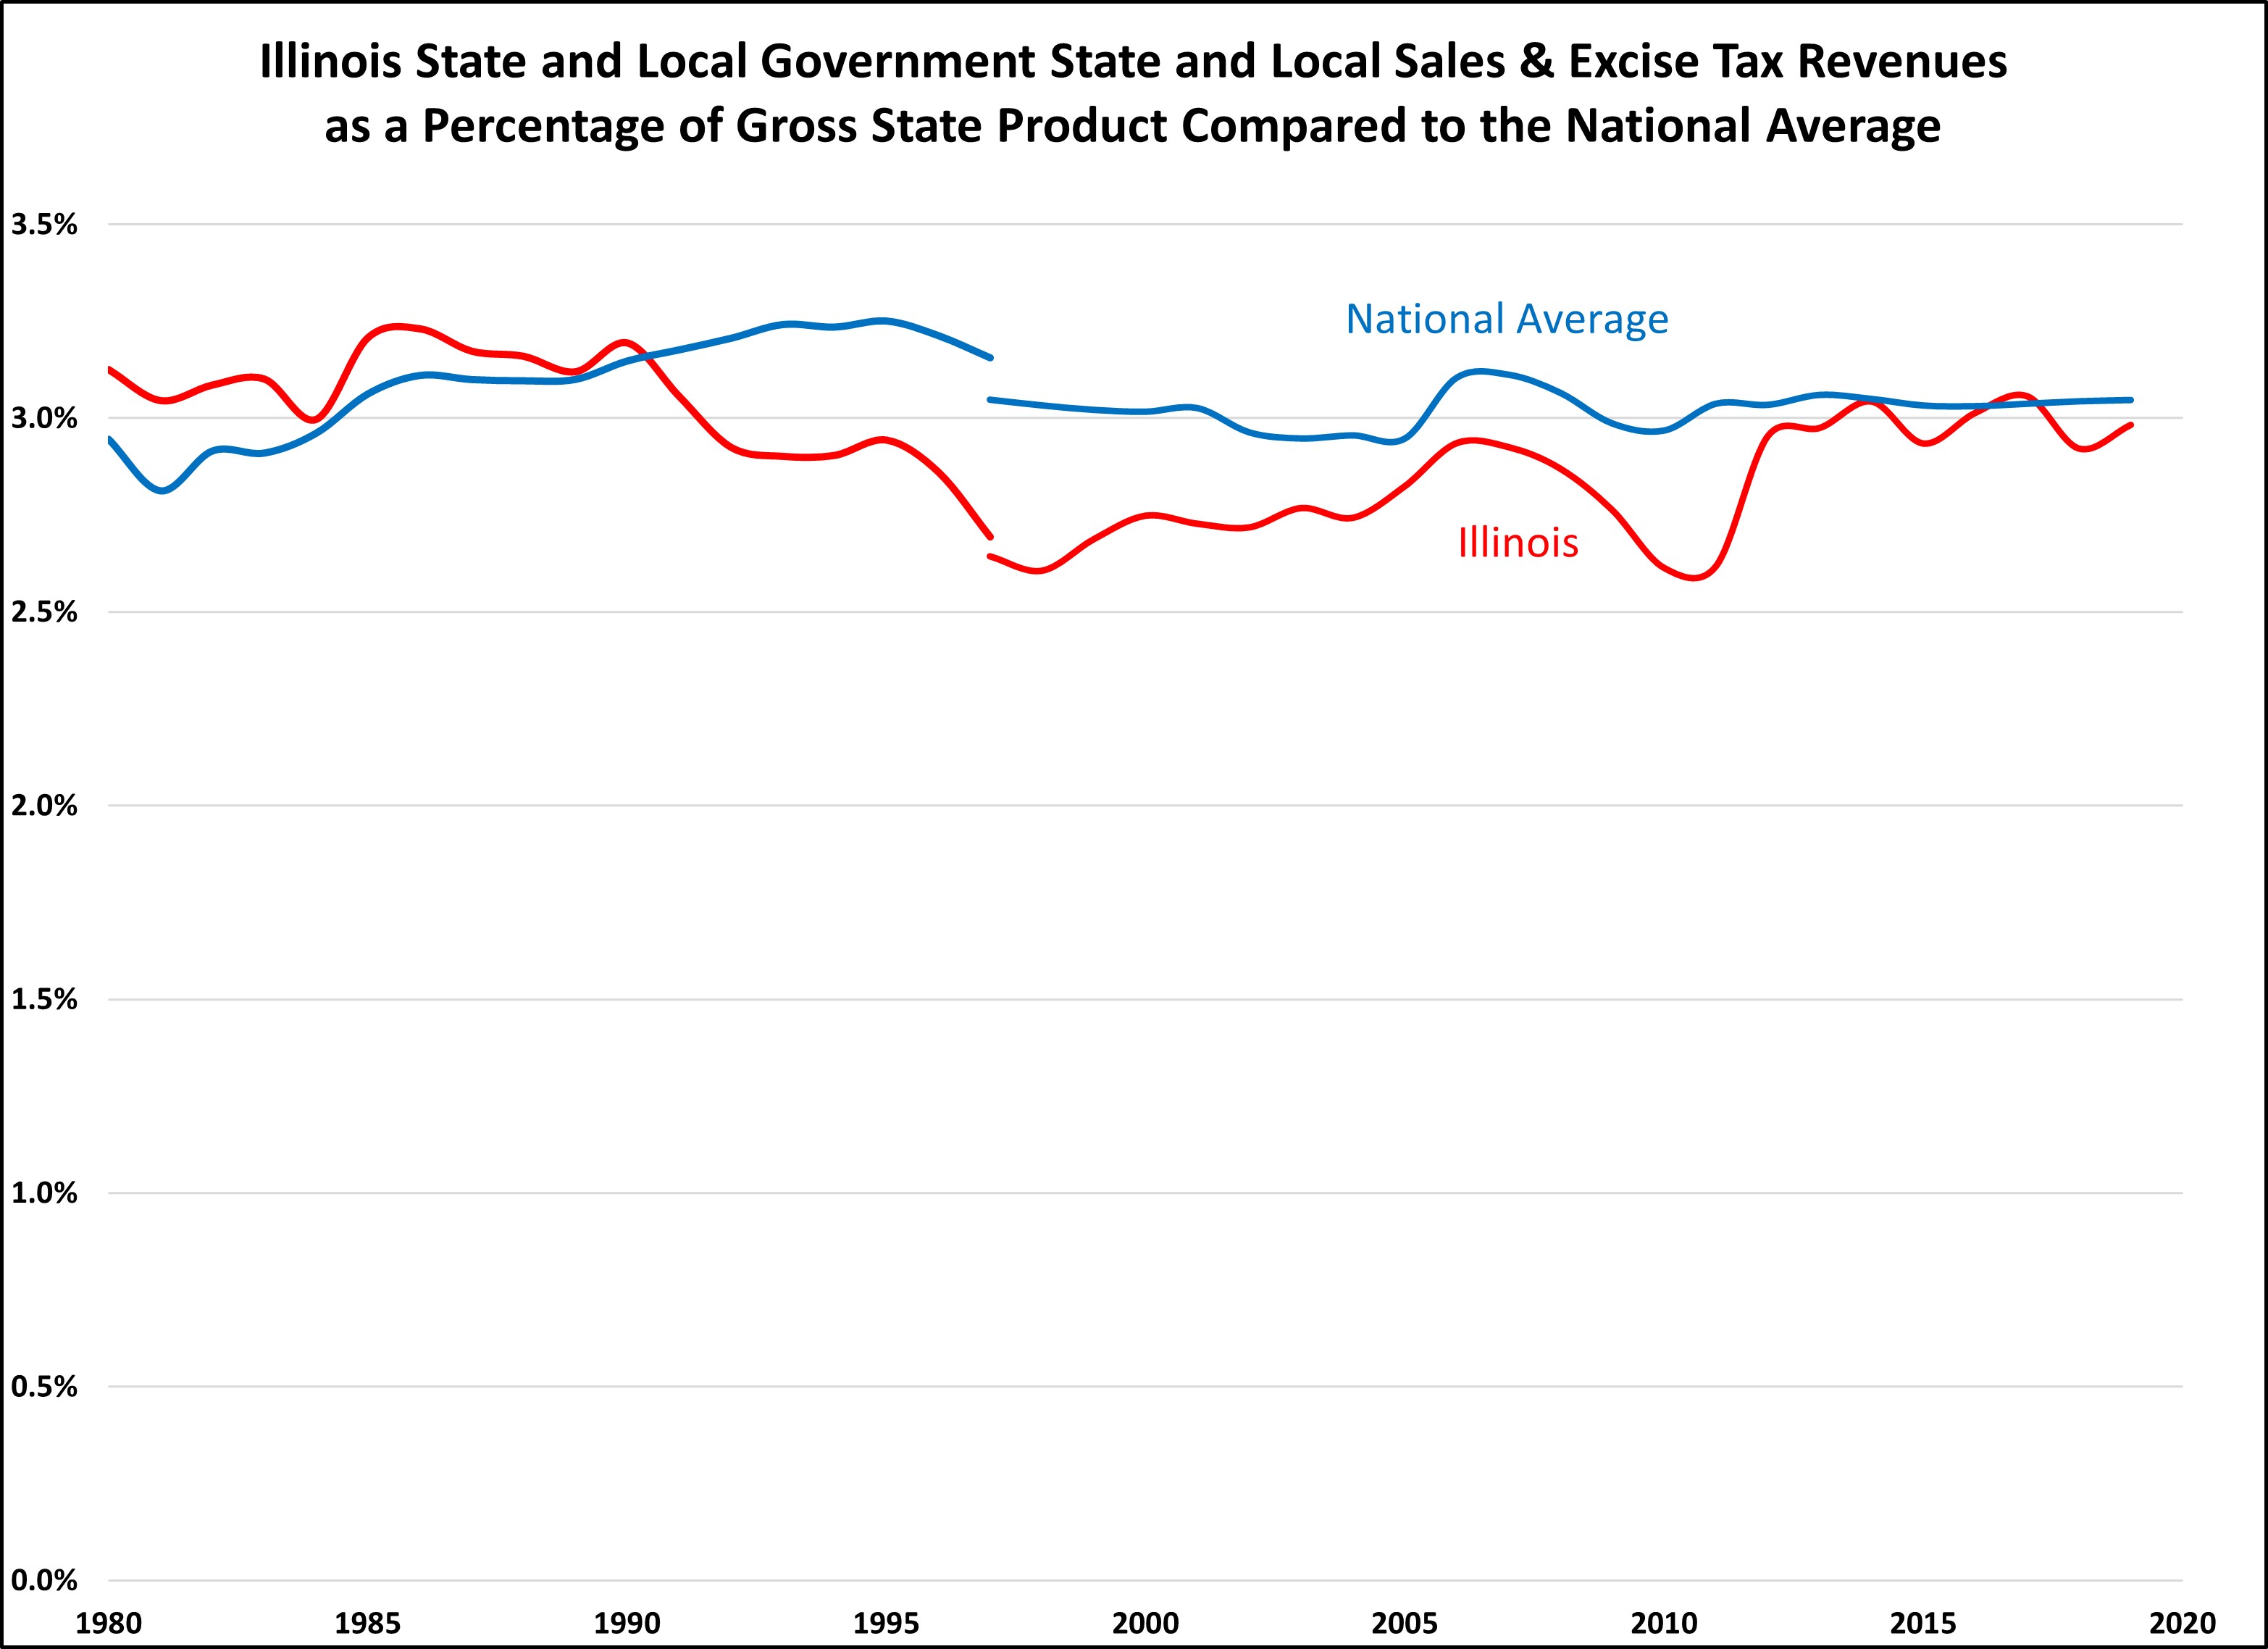
Looking at trends over time is important when comparing tax collections among states to avoid being misled by an unusual year. It is also important to understand the reasons behind those “trends”. In this chart, it looks like Illinois lowered sales and excise taxes dramatically in 1991. However, this reduction reflects a sales tax reporting error in Census Bureau data that began in 1991 and persisted until 2012, and not an actual reduction in taxes collected. The census data for Illinois sales tax between these years is, as a result, inaccurate. After the correction was made, Illinois has been much closer to the national average, as was the case before the error.
THE COMPONENTS OF ILLINOIS’ OVERALL SALES TAX MIX HAVE GROWN AT DIFFERENT RATES
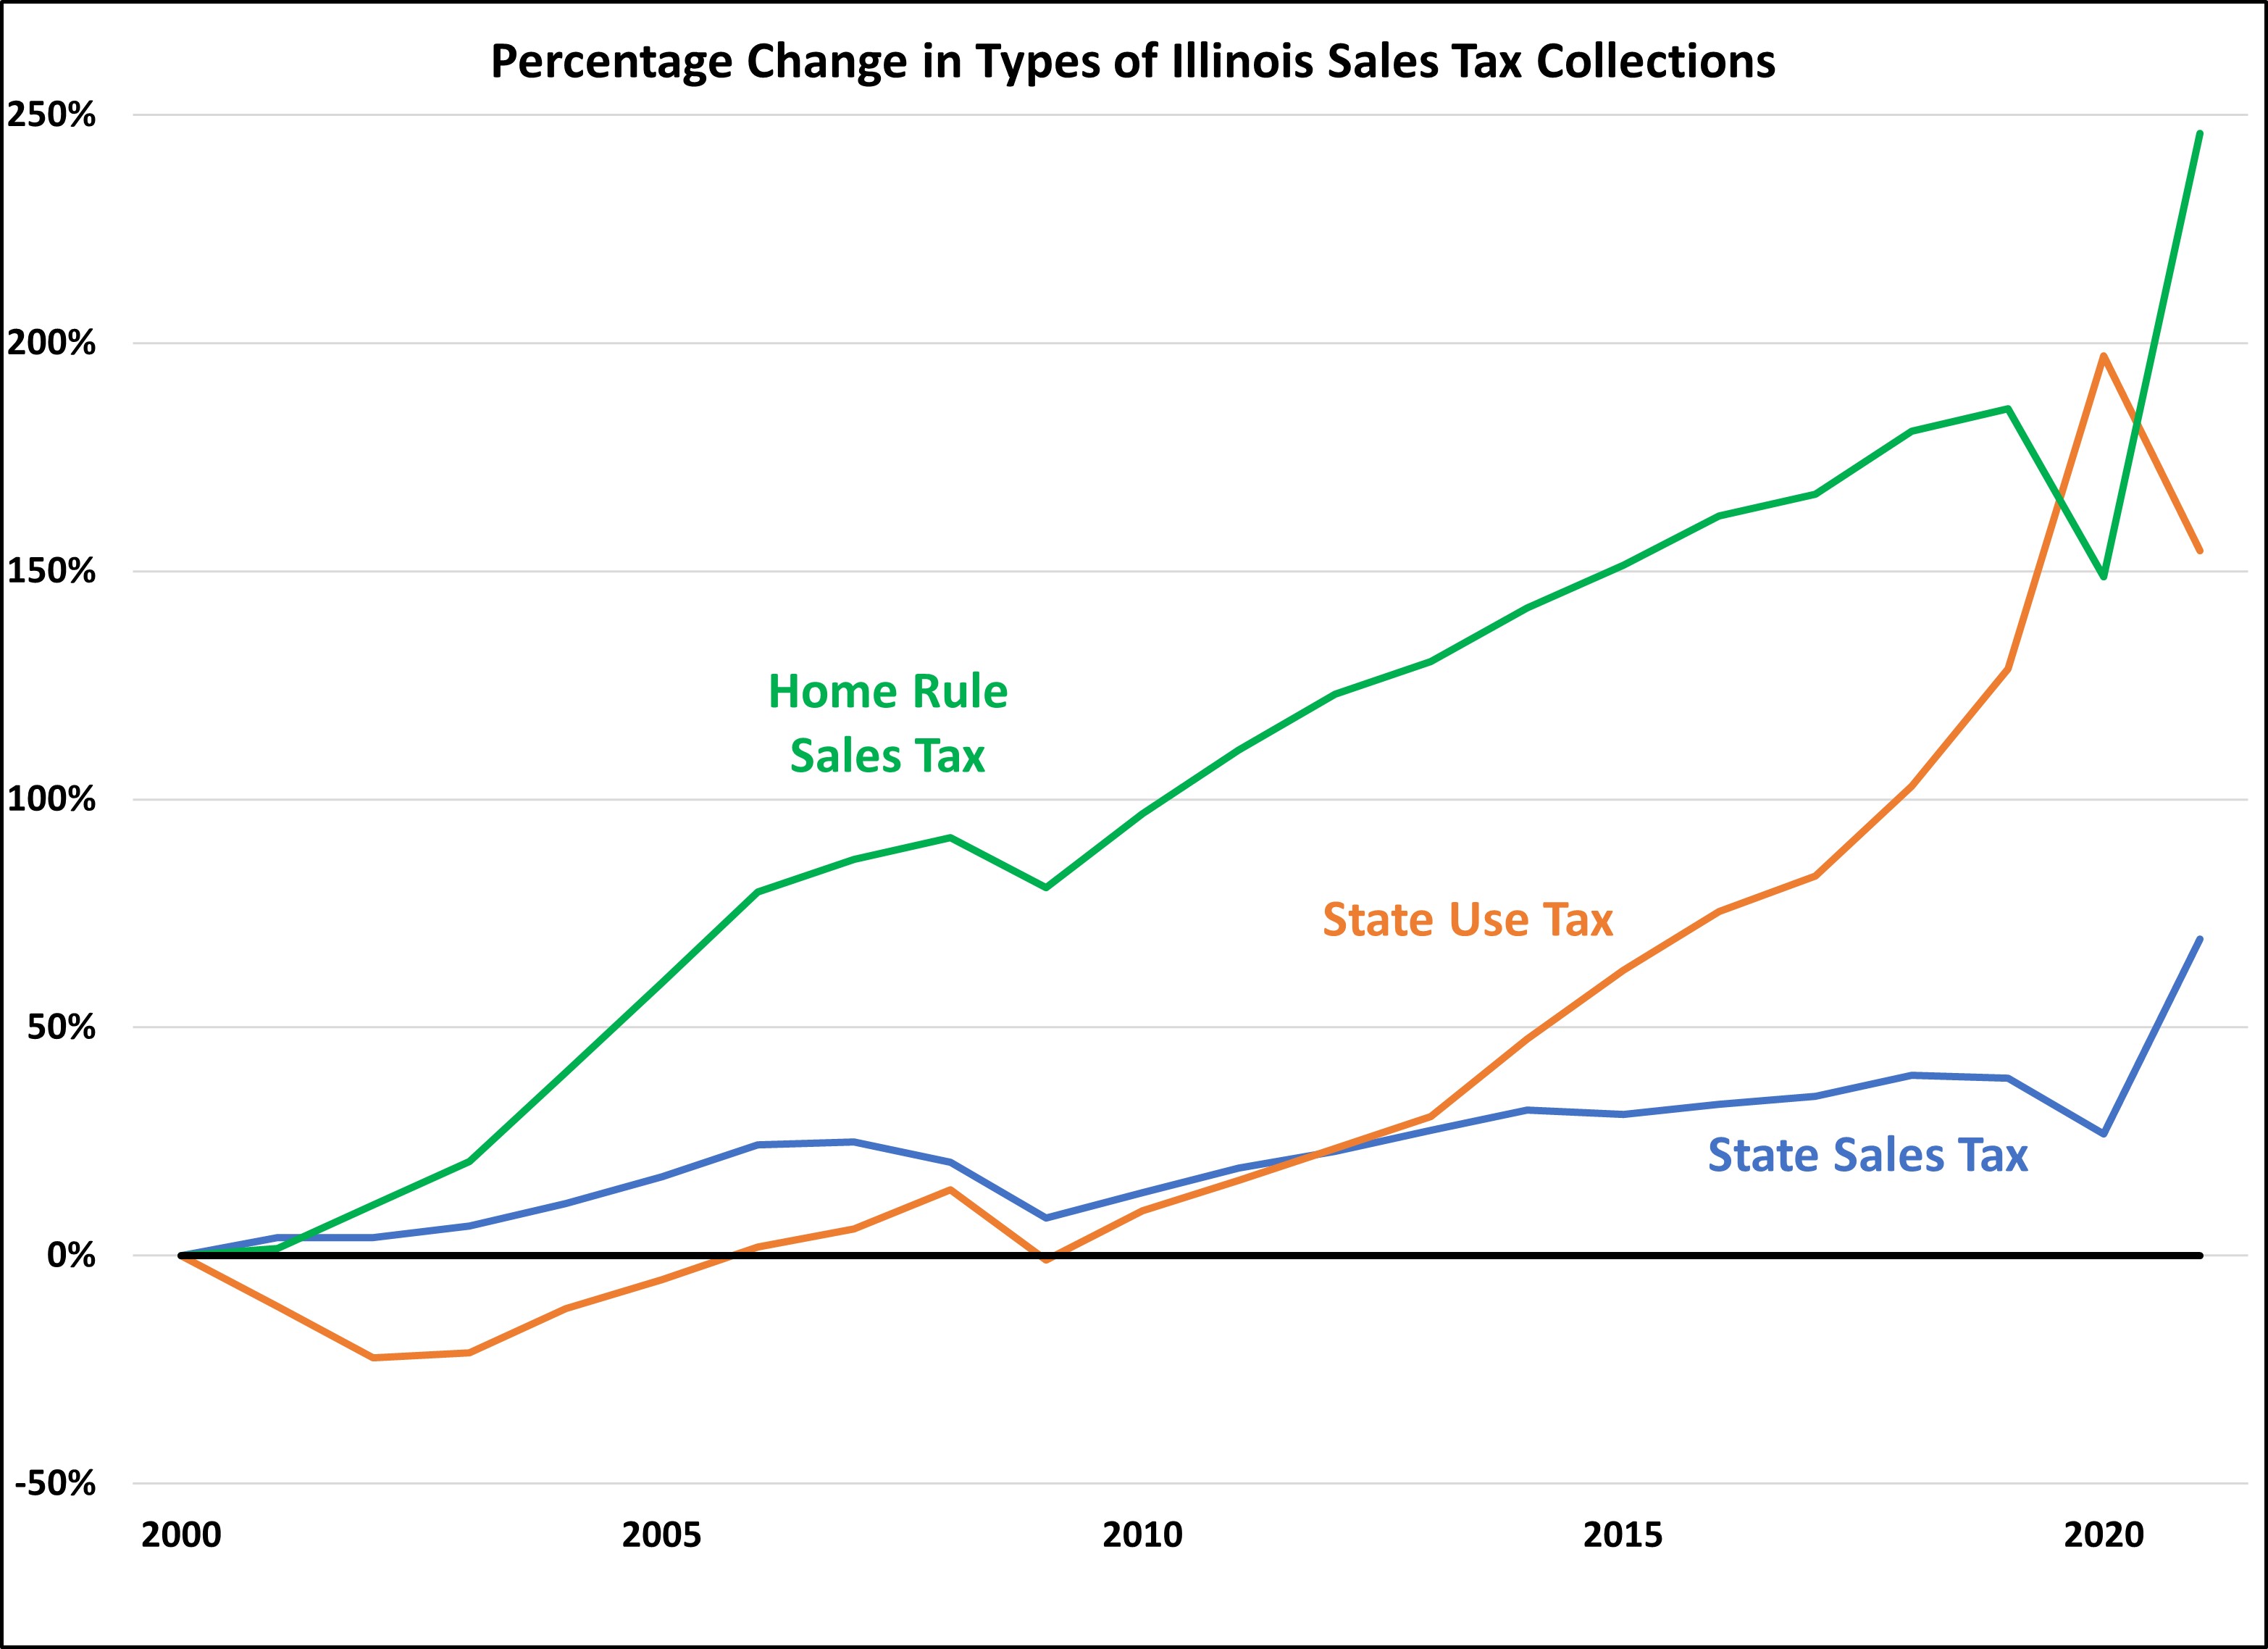
Changes in the economy, business practices, and of course tax law can affect tax collections. This chart shows how three different categories of taxes have changed in Illinois over the last two decades.
The most significant change in retail over the last twenty years has been the growth of e-commerce. Initially, most out-of-state retailers did not collect tax on online purchases, and the state had no jurisdiction to require it if the retailer had no physical presence in the State. In those situations, it was the buyer’s responsibility to pay use tax, but it often went unpaid. As business models changed, retailers started collecting use tax for these transactions, and a United States Supreme Court decision allowed Illinois to require collection, beginning in 2018. This increased collection, along with increasing online shopping, drove the increase in use tax. Until 2021, these sales were only subject to use tax and were not subject to any local sales taxes imposed by municipalities.
In 2020, COVID-19 caused a further increase in online shopping and a decrease in brick-and-mortar shopping, which is shown by the increase in the state use tax and a decrease in the state sales tax. Then Illinois’ tax laws changed in 2021, shifting a significant amount of e-commerce sales from use tax to sales tax, and local sales taxes applied to those sales. This is the cause of the decrease in the state use tax and a corresponding increase in the state sales tax and home rules sales tax.
Finally, over the last twenty years, there has been a steady increase in home rule sales tax collections. Municipalities imposing sales taxes for the first time and increasing tax rates are the primary drivers of this increase. (As noted above, the jump in 2021 was due to the state law change that applied home rule sales taxes to some internet sales.)
MOST STATES EXEMPT GROCERIES FROM SALES TAX
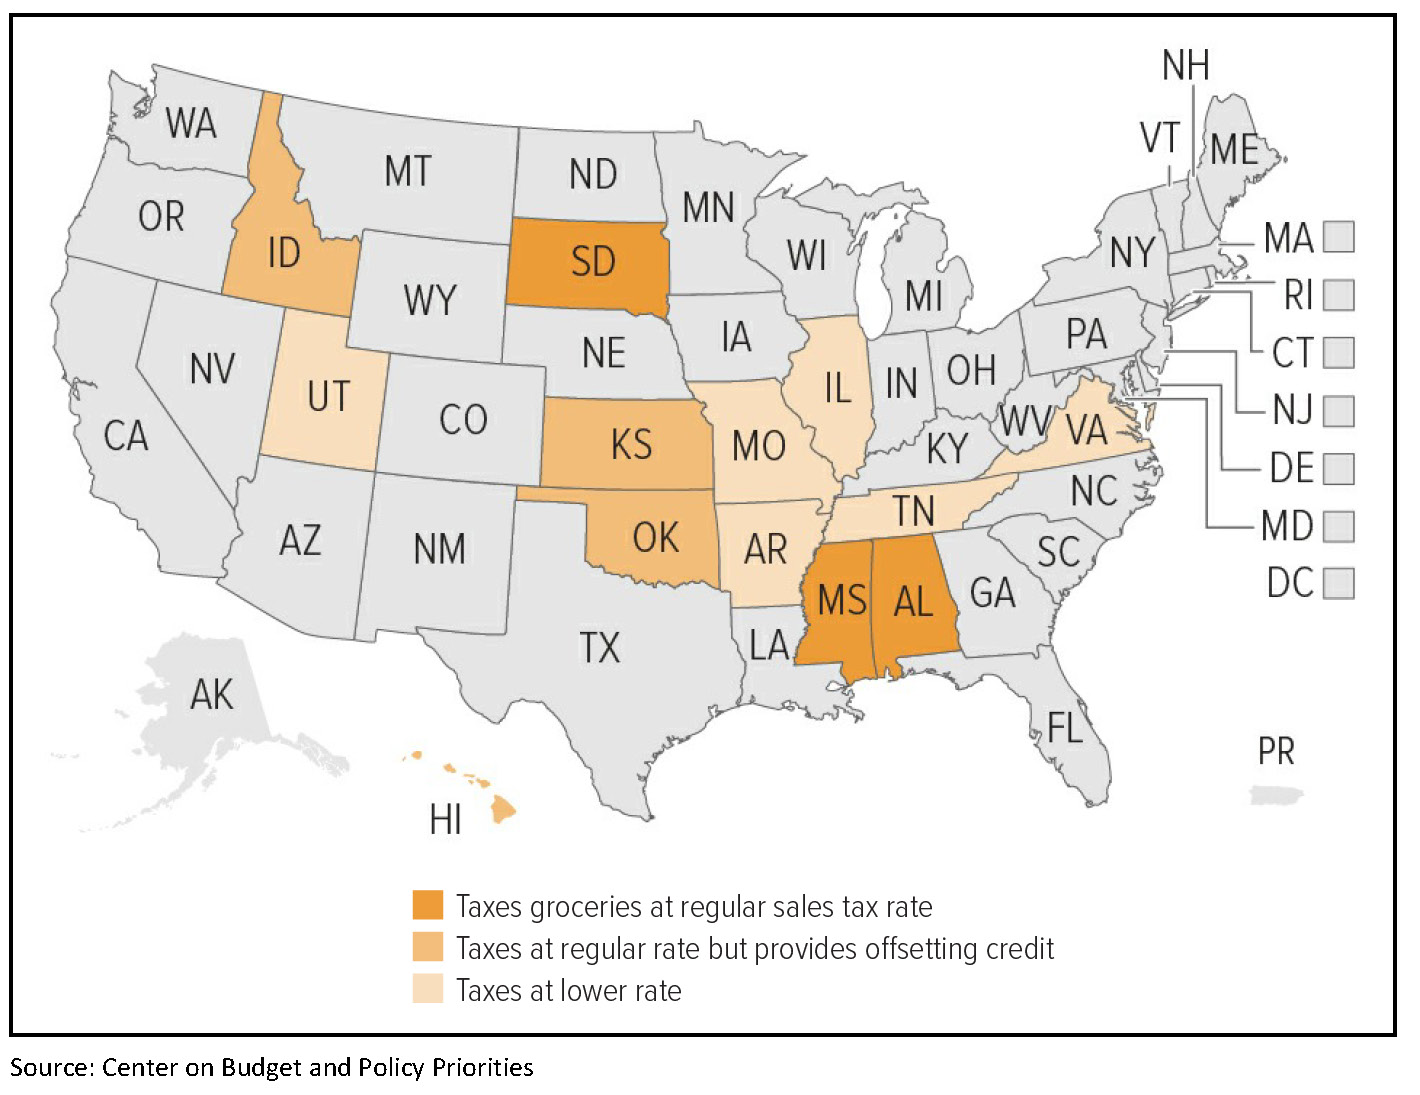
Generally speaking, sales taxes are intended to apply to all purchases for final consumption. One area where many states, including Illinois, depart from this policy is in the taxation of groceries. As the map above indicates, very few states impose sales tax on groceries. Of those with a “grocery tax,” most are at a reduced rate (1.25% in Illinois) or the states offer income tax credits designed to offset the burden on low- and middle-income taxpayers.
A few additional points to note:
- Illinois’ lower rate of tax on groceries goes entirely to local governments.
- Federal law prohibits state and local governments from charging sales tax on purchases made using Supplemental Nutrition Assistance Program (SNAP, formerly known as food stamps) benefits.
- Not all food items qualify for exemption, in Illinois or elsewhere. Candy, soft drinks, and ready-to-eat prepared food are frequently taxed.
METHODOLOGY
Charts like these are only as good as the underlying data. The charts consistently rely on data from the United States Census Bureau, specifically, the Annual Survey of State and Local Finances. Some states have taxes which do not fit neatly into a category, such as Washington’s Business and Operations Tax, a gross receipts tax on businesses. Some might think it should be classified as a corporate income tax. However, the census classifies it as a sales and excise tax. There are other instances where the Census guidelines and classifications may not be intuitive, but for simplicity and consistency, we follow the Census classifications.
We are aware of flaws in the Census data. The sales tax data for Illinois was incorrect for approximately twenty years. For FY 2018 & FY 2019, there was a mistake with Illinois’ individual and corporate income tax data. The Census will update this figure but until then, we are using the corporate and individual income tax data from the Illinois Comptroller.
Additionally, the Census did not perform the State and Local Government Survey in 2001 and 2003 so data is unavailable for those years.
Despite these faults with the Census data, it is the best data source that exists to compare state and local government taxes.
In 1997, the U.S. Bureau of Economic Analysis changed how gross domestic product and gross state product were calculated, resulting in a slightly higher value. This is why there is a break in the historical chart above.
* Maurice Scholten is Legislative Director of the Taxpayers’ Federation of Illinois.