
Income Taxes – How Does Illinois Compare?
Income Taxes – How Does Illinois Compare?
February 2022 (75.2)
by Maurice Scholten*
People frequently ask how taxes in Illinois compare to those in other states. The answer to that question depends on who you ask. Advocates for increasing government spending present statistics that show Illinois as a low-tax state, while those who want a more limited role for government present statistics that show Illinois as a high-tax state. We are releasing a series of Tax Facts articles attempting to provide a true picture of where Illinois stands. The January issue of Tax Facts looked at the overall tax climate in Illinois, and now we are focusing on income taxes.
Two key points about how we undertake this comparison of state taxes:
• First, it is imperative to look at state and local taxes combined. Some states pay for services with state funds, while others leave that funding to local governments and local taxes. Furthermore, a person buying $100 worth of groceries and other household goods usually does not know (or care) who imposed the sales tax on those goods, and which government receives the tax.
• Secondly, we contend that tax collection rankings should reflect different economies in different states (which often reflect different costs of living and income levels). For example, let’s assume
States A and B both have a flat income tax rate of 5%, but in State A the median personal income is $50,000, and in State B the median personal income is $55,000. As a result, the median State A resident would pay $2,500 in income taxes and the median State B resident would pay $2,750. Even though the two states have the same rate, the State B resident pays more in absolute dollars, but she also has more after-tax income. Does State B have higher taxes, or are they equal? We would posit that they are equal, so a per capita comparison would not adequately capture the differences between State A and B. To reflect this properly, we look at taxes as a percentage of gross state product (the total value of all goods and services produced within the State) to arrive at the percentage of economic output diverted to taxes.
Finally, in terms of presentation, rankings make good headlines, but the bar graphs we use make it easier to visualize if a state is an outlier, and if so by how much. For example, if a state has the highest taxes in the country but is only slightly higher than the national average, then that #1 ranking means very little, because all the states have essentially the same tax burden. On the other hand, if a state is ranked 10th but it is significantly above average, the fact that nine states have higher taxes does not provide much comfort to that state’s citizens.
We use the most recent data that the Census Bureau has released, which is for FY 2019. This data predates COVID-19 which has had a significant impact on everything, including state and local taxes. We will update these charts when the Census Bureau releases updated data.
INDIVIDUAL INCOME TAXES IN ILLINOIS ARE ABOVE AVERAGE
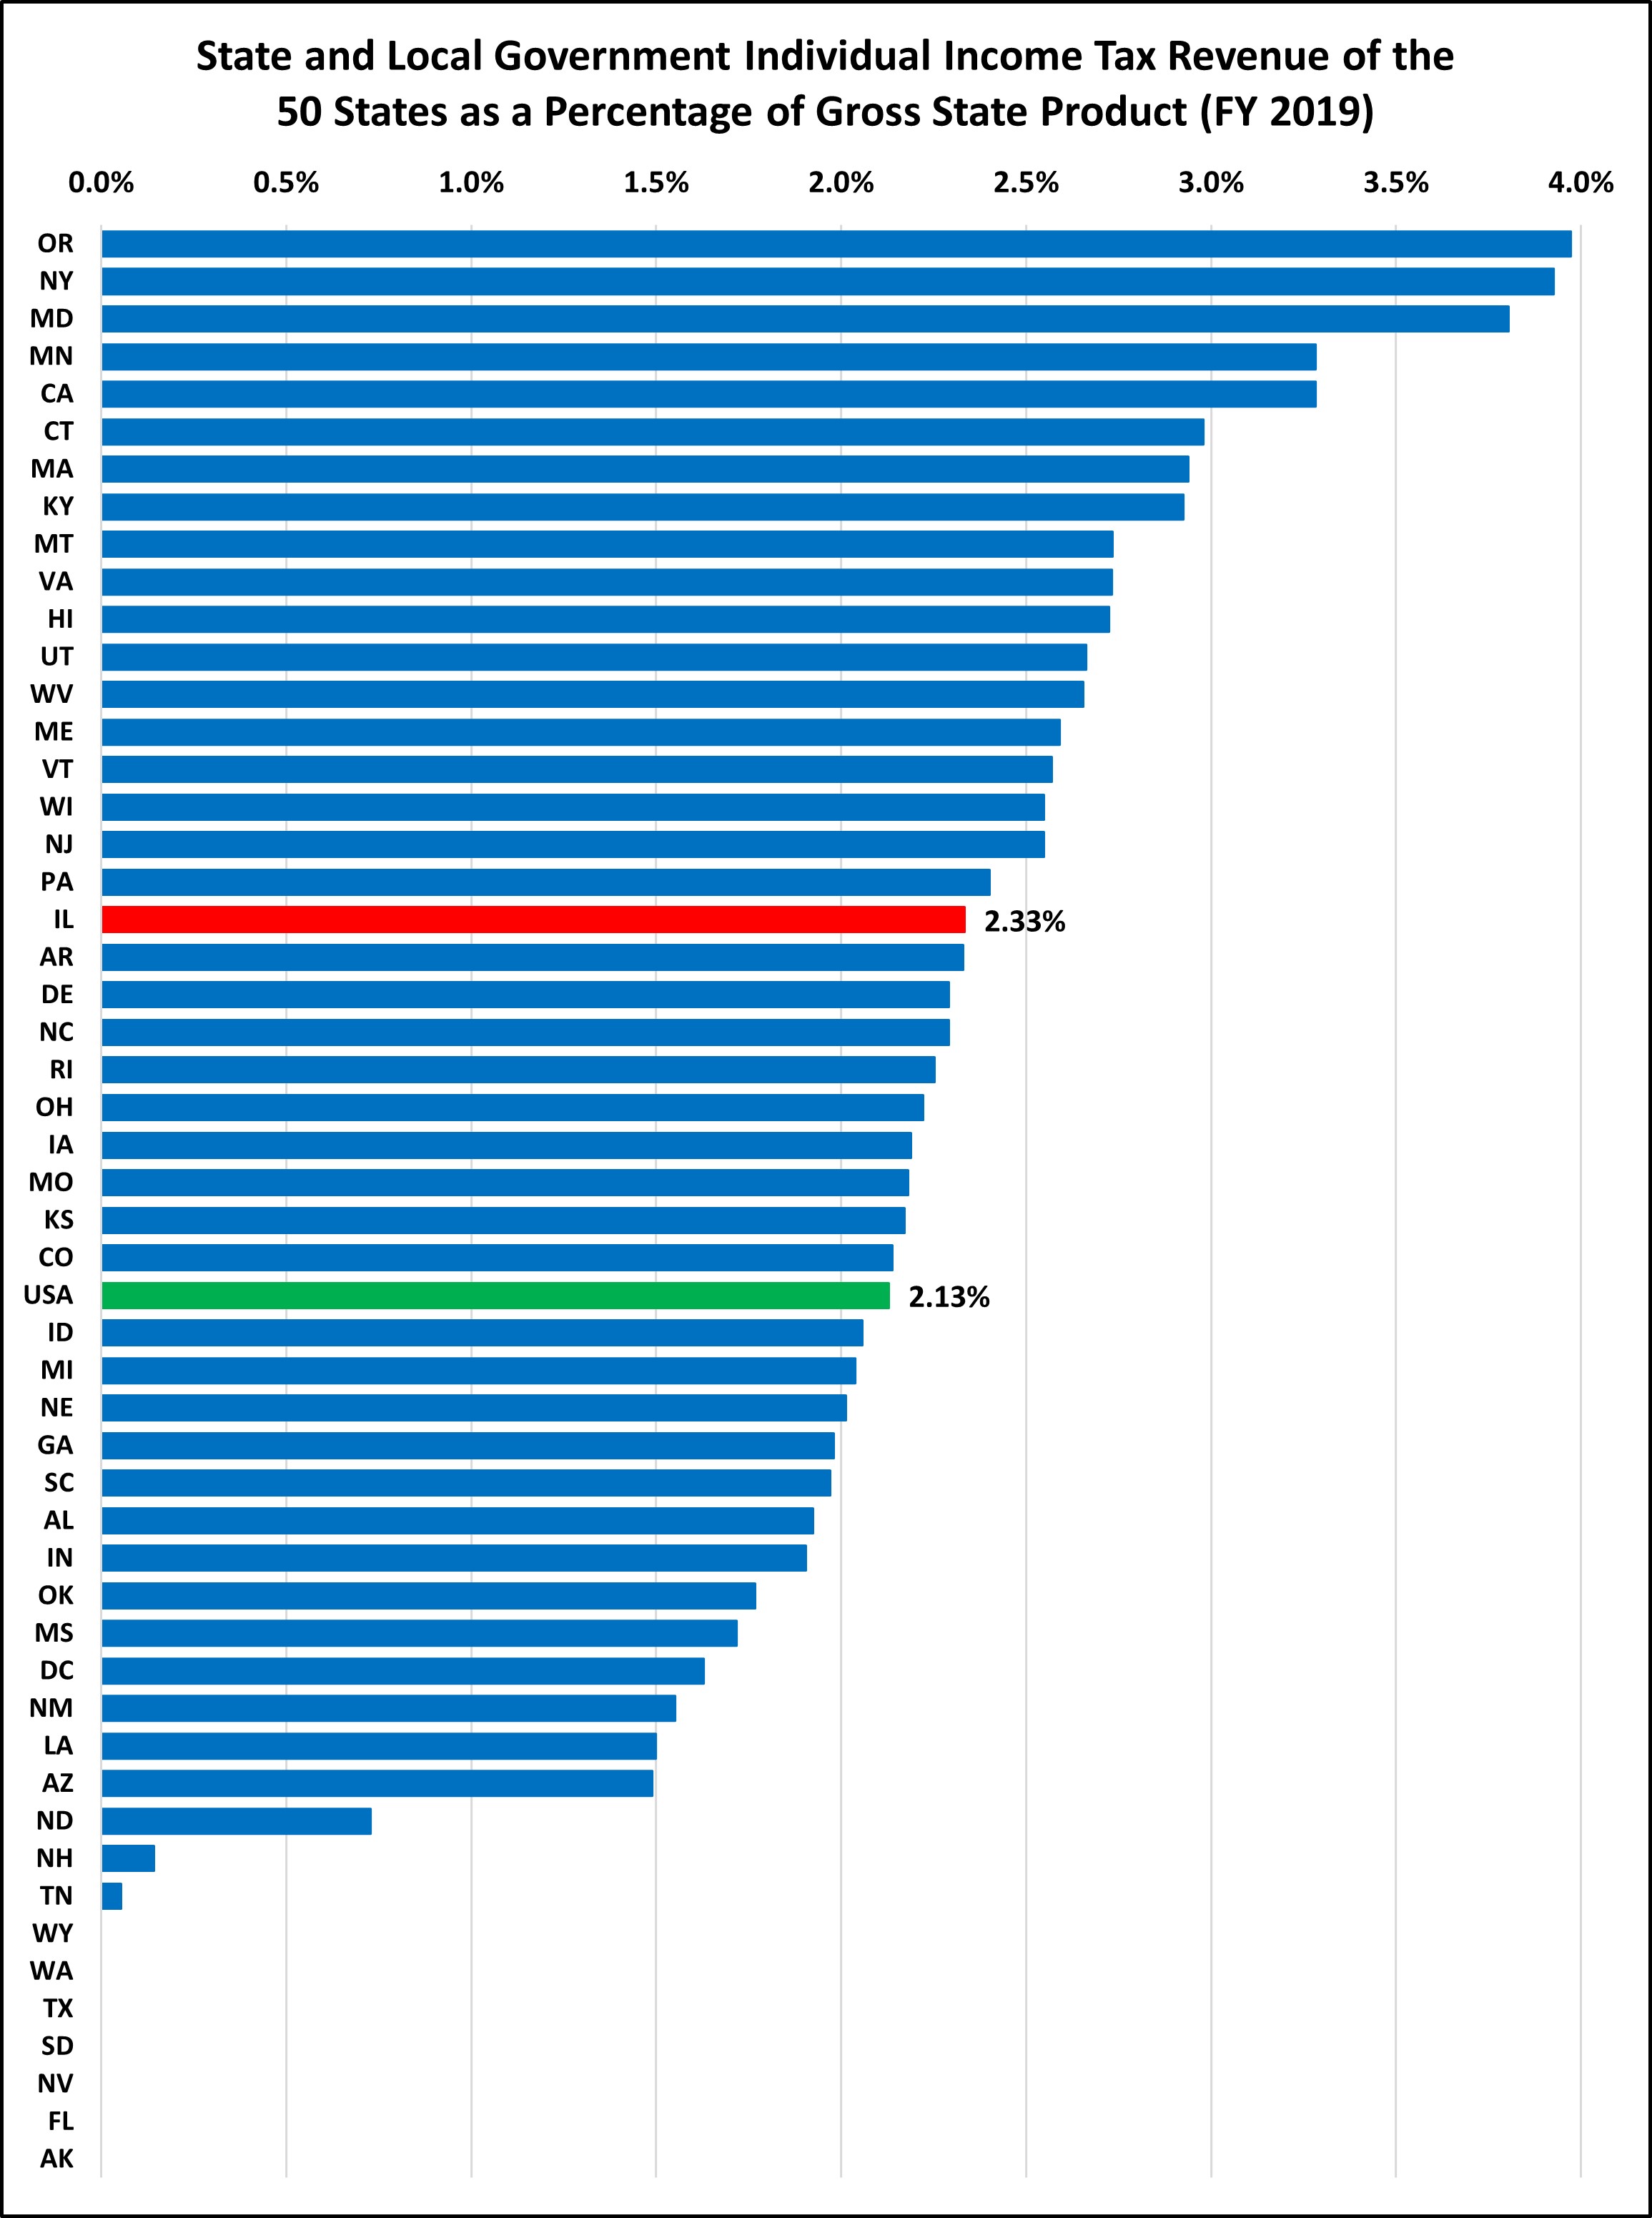
Some say that income taxes are high in Illinois. This chart shows that individual income taxes as a percentage of gross state product are indeed above average, but not significantly. And there are plenty of states with even higher taxes. It may come as a surprise to see that our neighbors Wisconsin and Kentucky collect more than Illinois. Keep in mind, however, that an individual’s personal results can vary significantly based on their income level, especially in states with a graduated rate structure.
ILLINOIS INDIVIDUAL INCOME TAXES HAVE HISTORICALLY BEEN BELOW AVERAGE
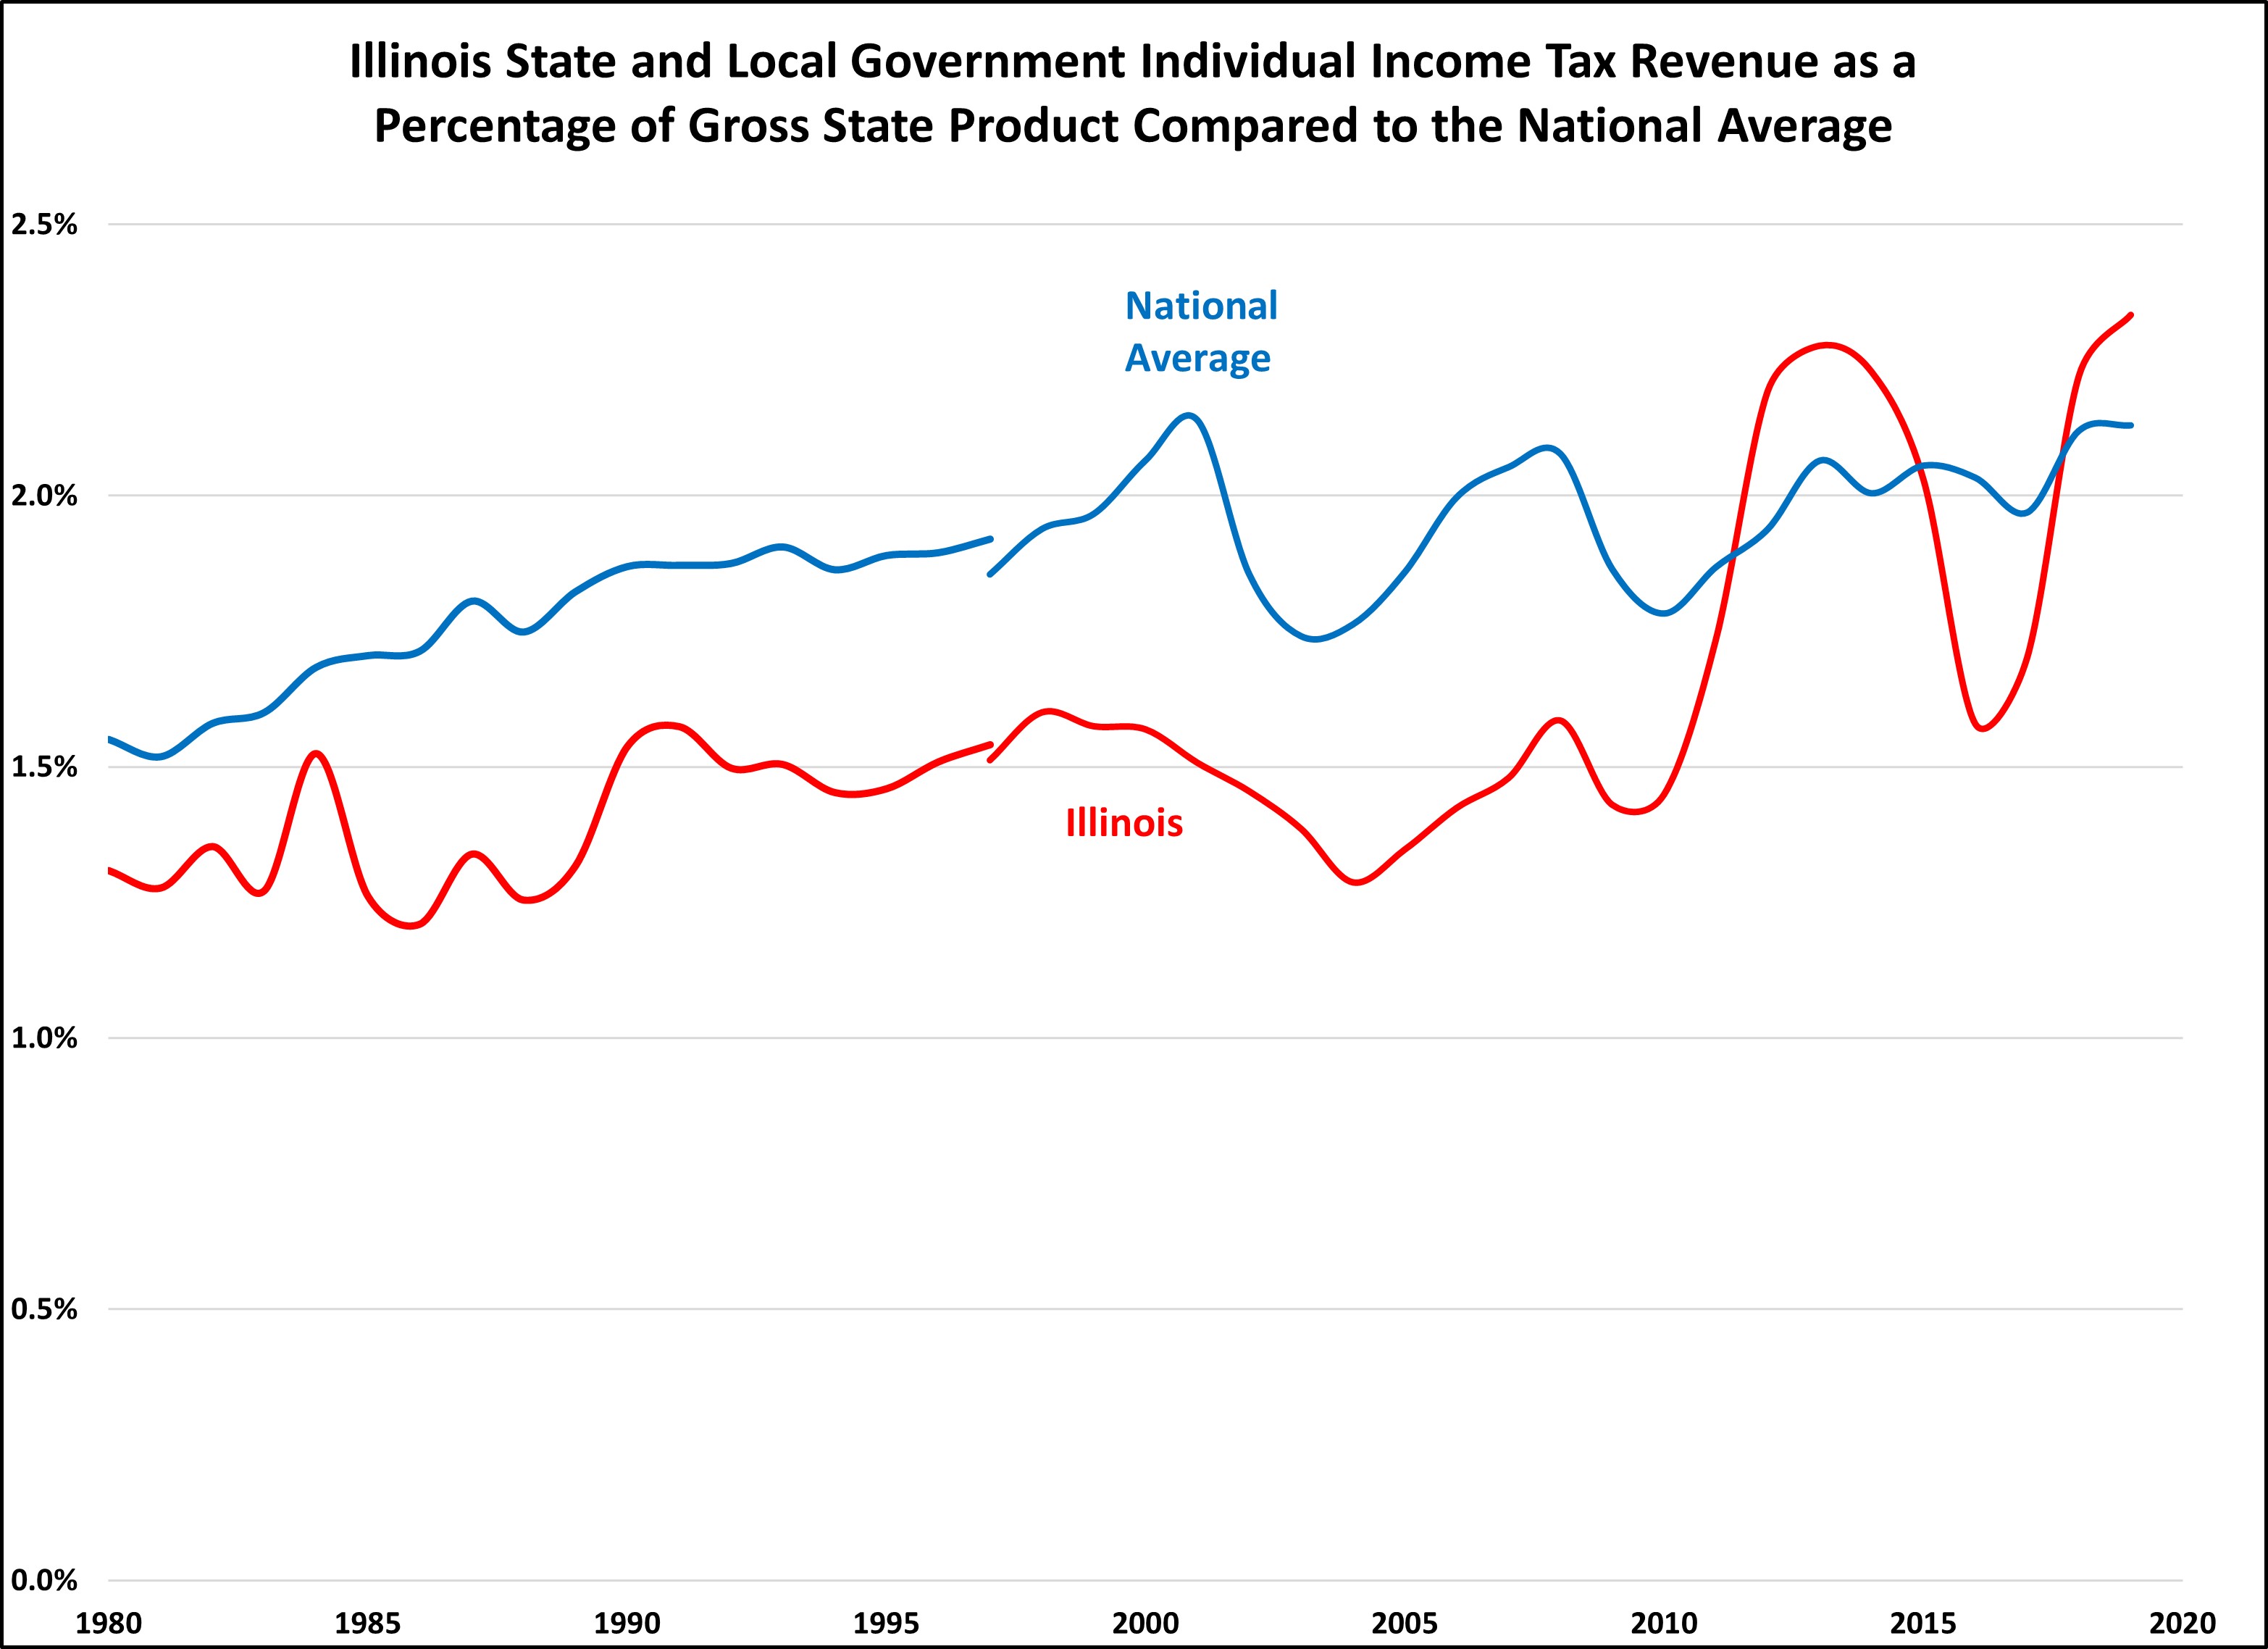
Individual income tax collections in Illinois had traditionally been below the national average. This changed when rates were increased in 2011. When the rates dropped in 2015, we were once again below the national average. Rates were increased again in 2017, and Illinois returned to above average.
THE AMOUNT OF INCOME EARNED SIGINIFICANTLY AFFECTS INTERSTATE COMPARISONS
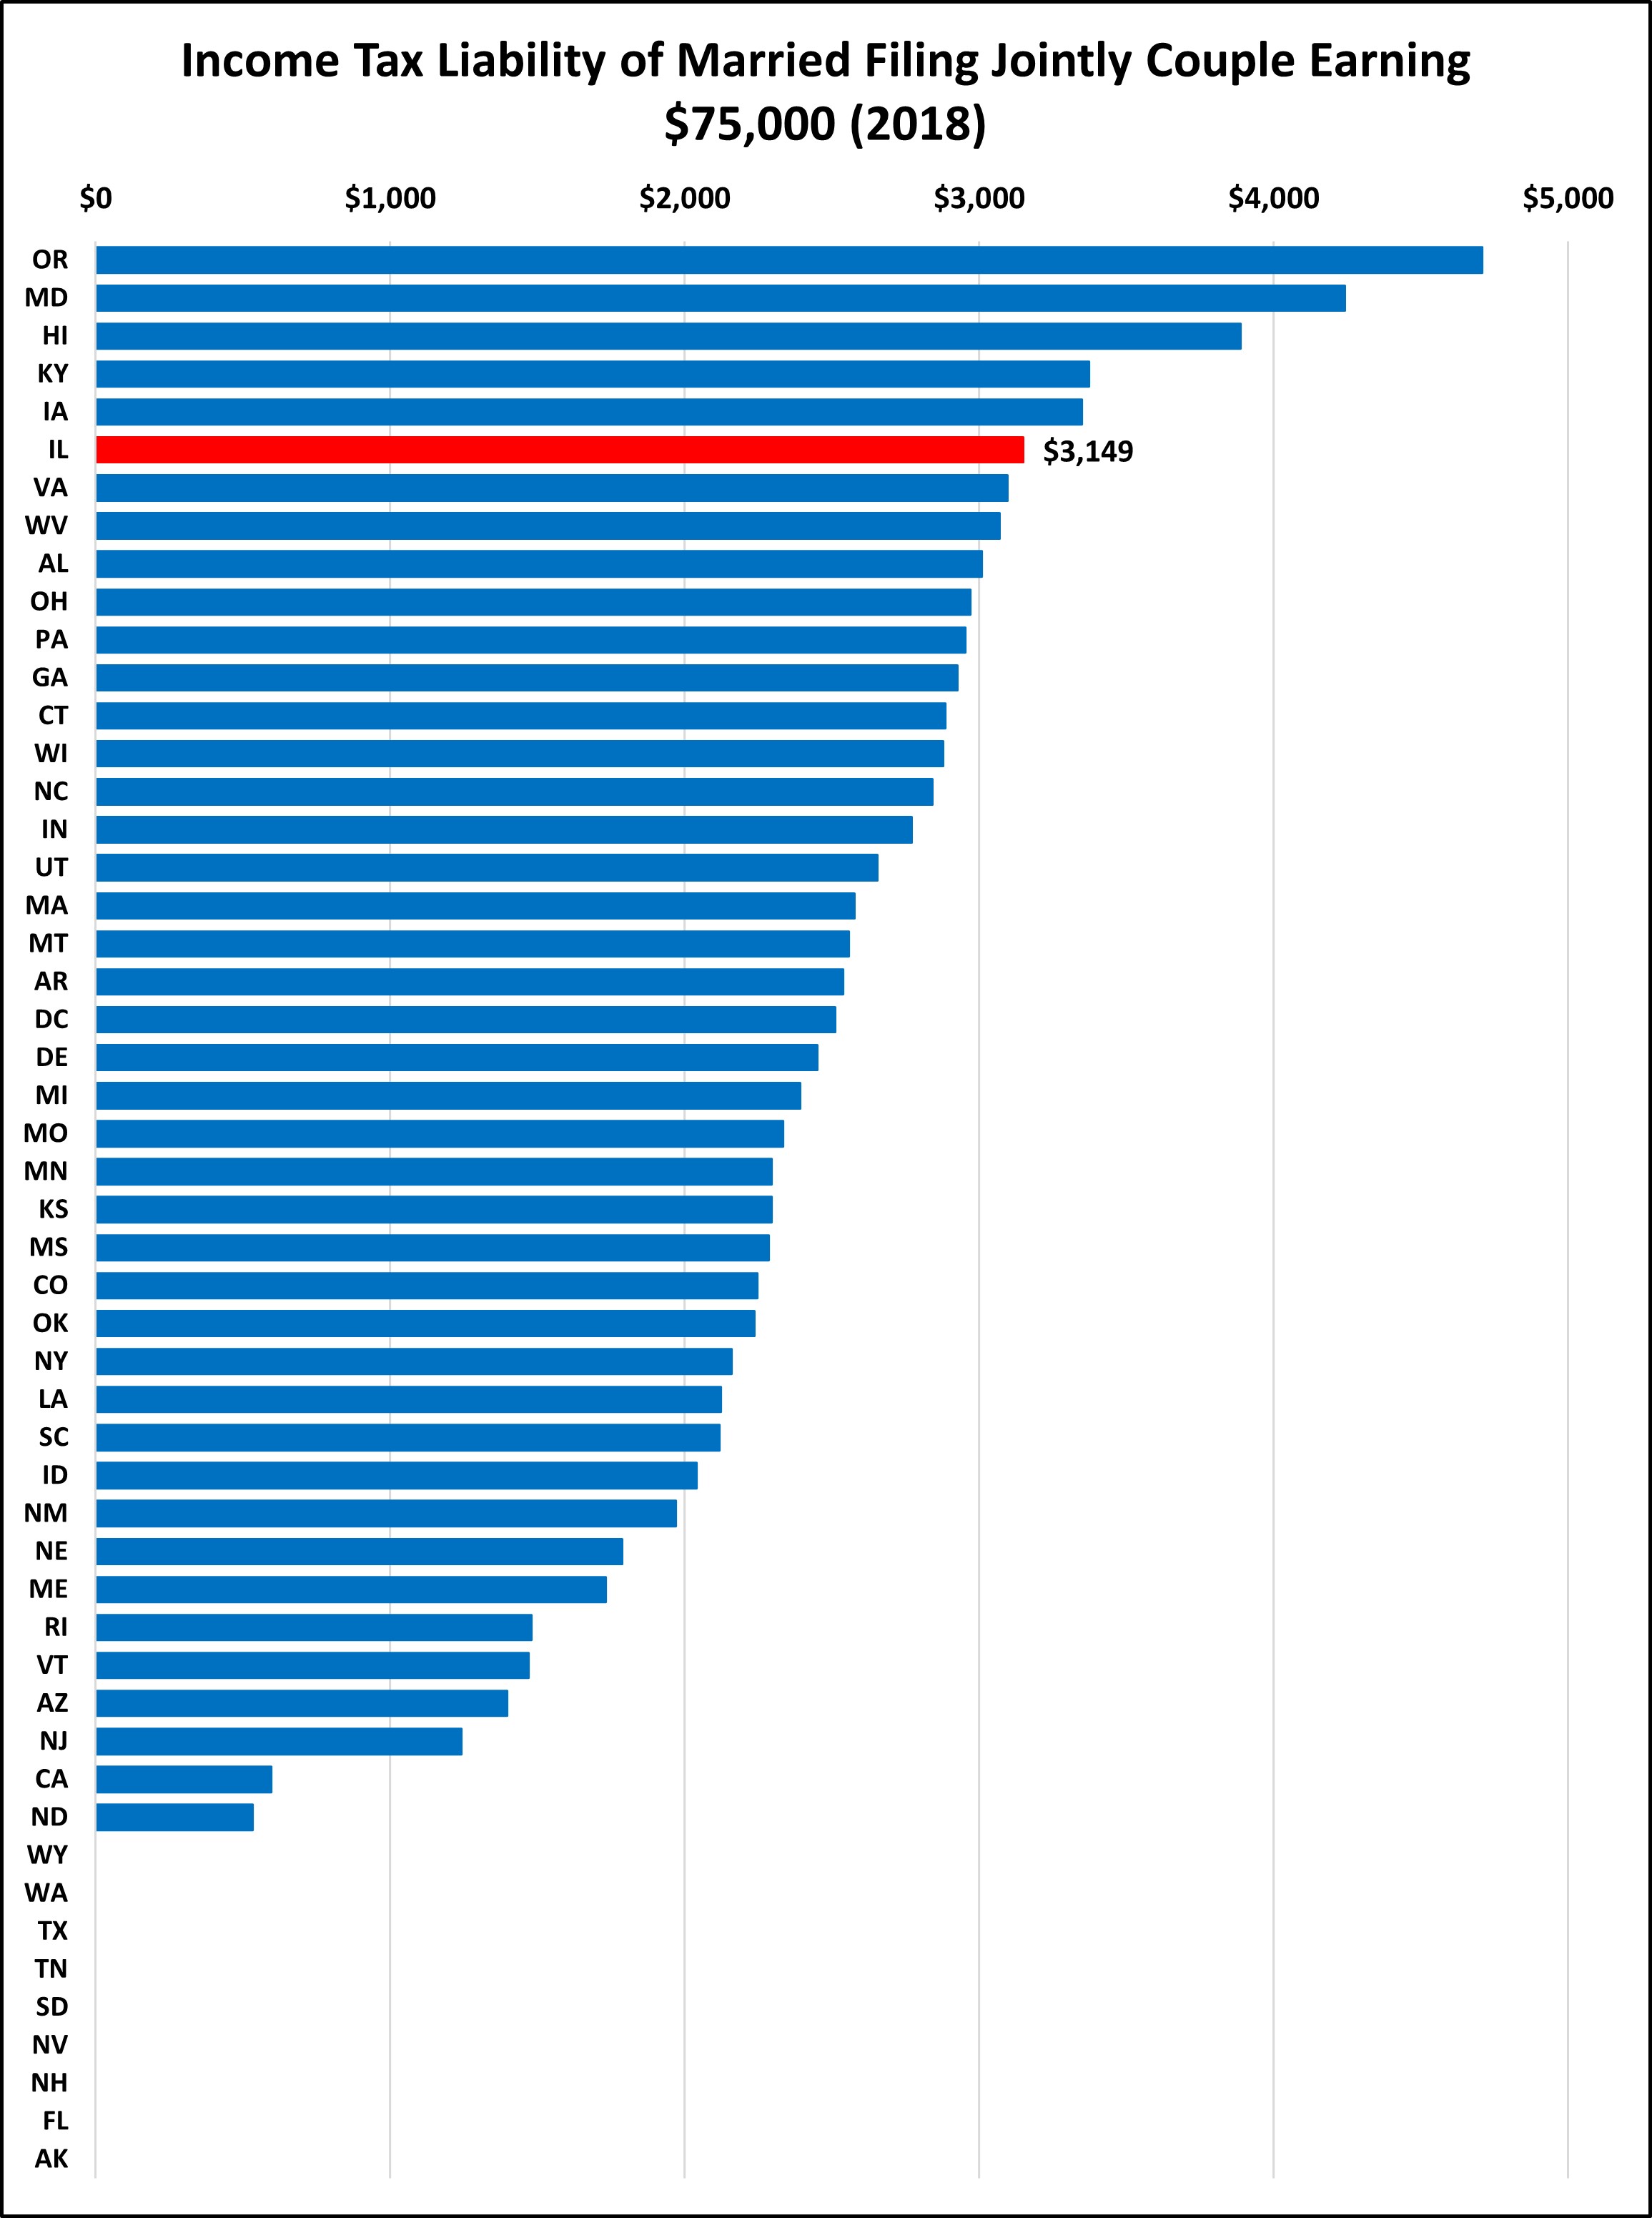
These two charts show how different taxpayers fare in Illinois compared to other states, depending on the taxpayers’ income levels. California is considered a high tax state, but a California family earning $75,000 pays a fraction of what an Illinois family at that income level pays.
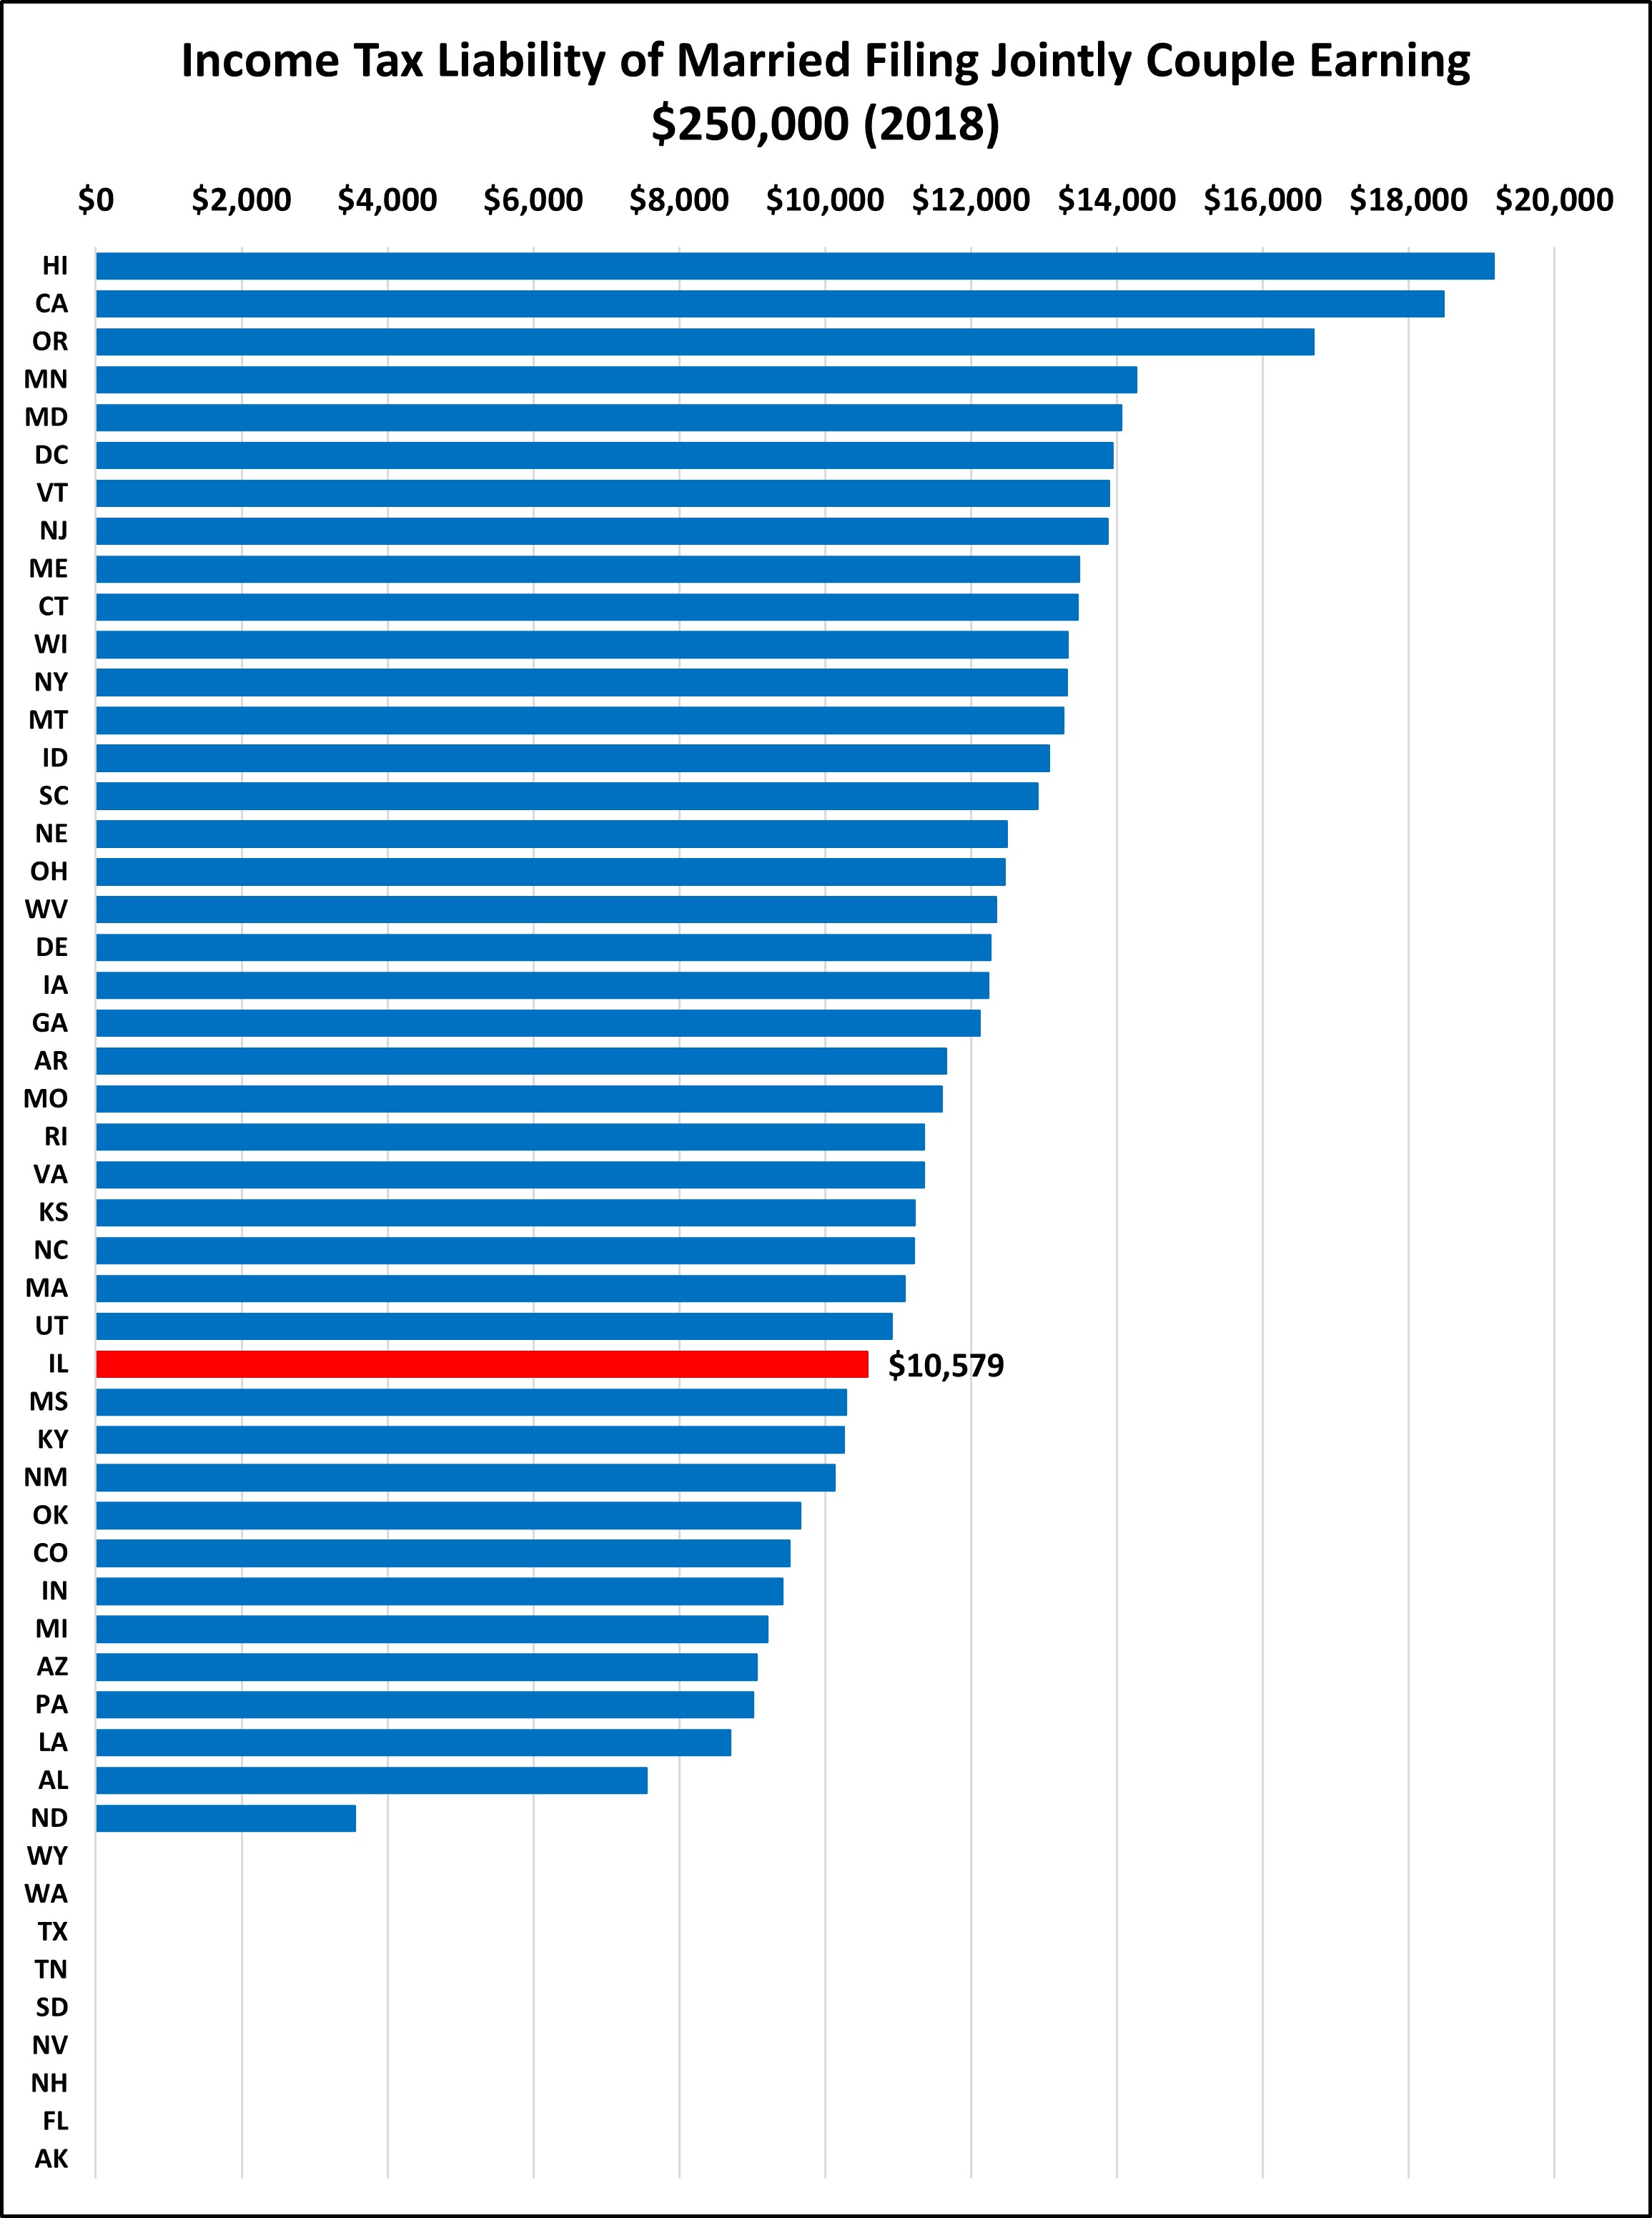
For the state as a whole, income taxes are just slightly above the national average, as shown on page 2. However, a family earning $75,000 pays an amount significantly above average, while a family earning $250,000 pays a below average amount.
ILLINOIS’ RETIREMENT EXEMPTION IS GROWING FASTER THAN INCOME
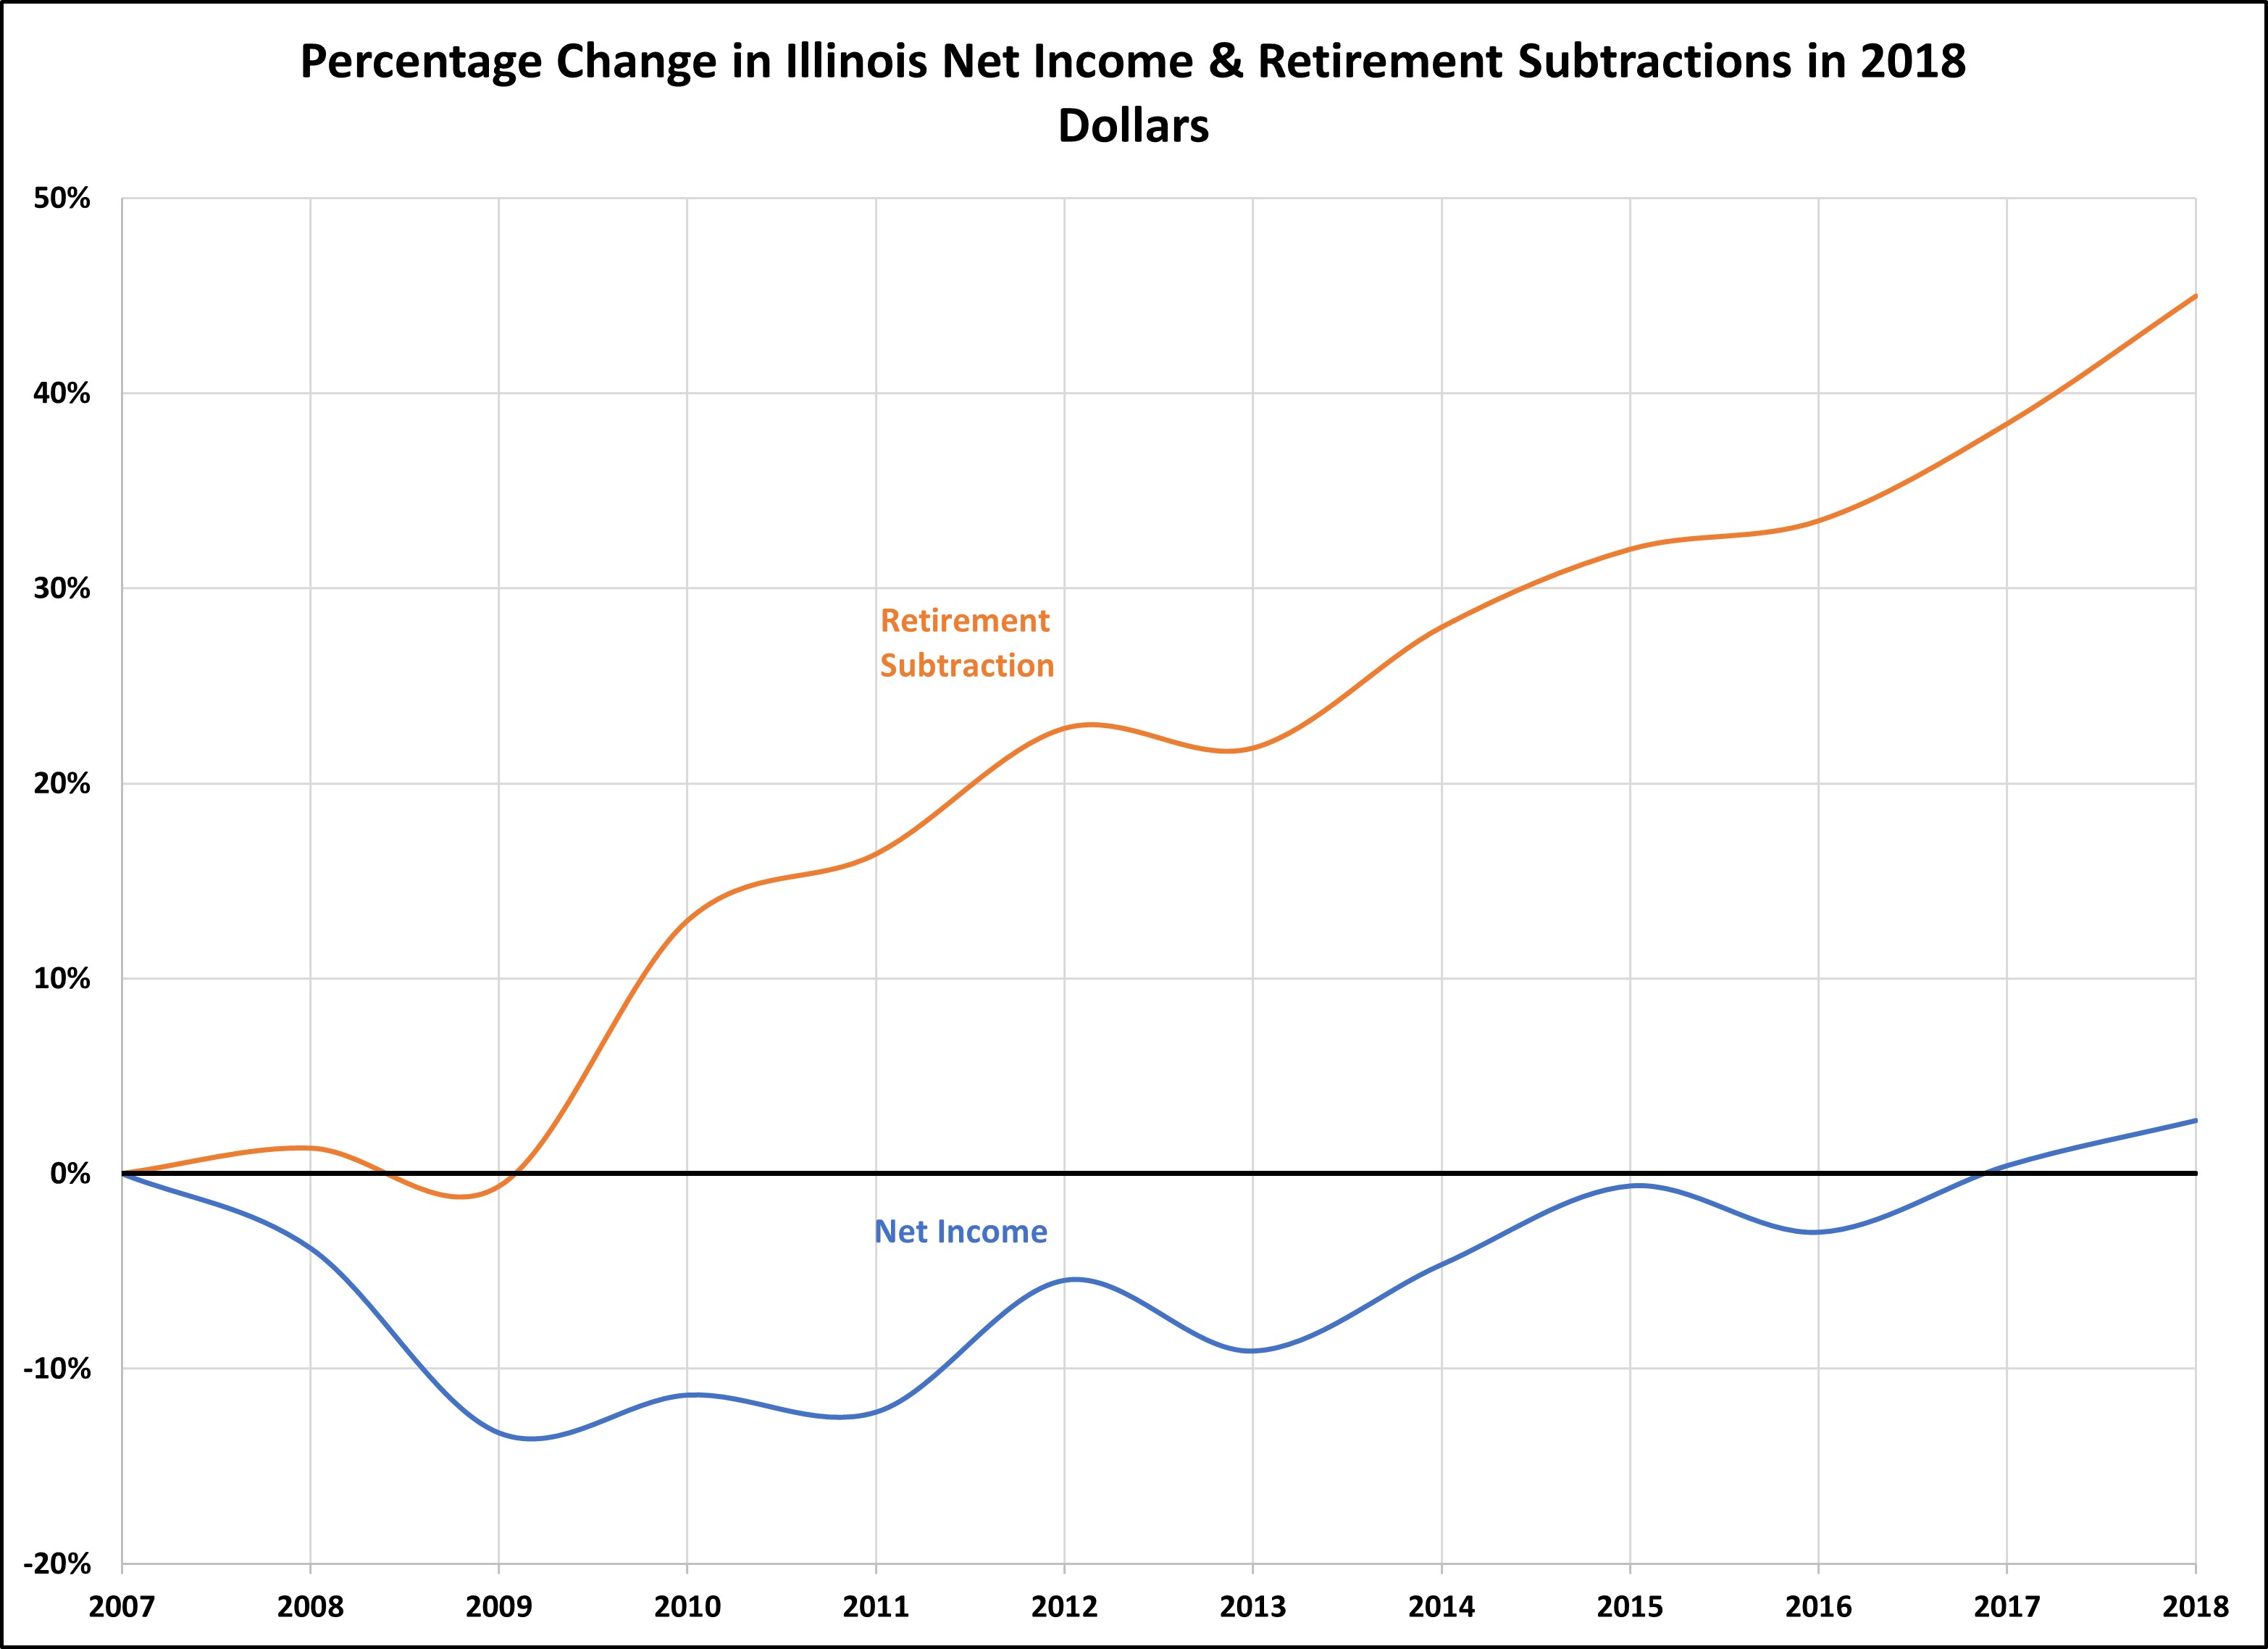
All retirement income, whether or not it is taxed by the federal government (and most of it is), is exempt from Illinois income tax. This chart shows the growth in the retirement exemption and the income tax base since 2007 in 2018 dollars, to adjust for inflation. While the amount of income received but not taxed under this exemption grew by over 40% during this time period, the income tax base grew by less than 5%. This trend is likely to continue. In 2018, the retirement exemption cost $2.9 billion.
ILLINOIS CORPORATE INCOME TAX COLLECTIONS ARE HIGH
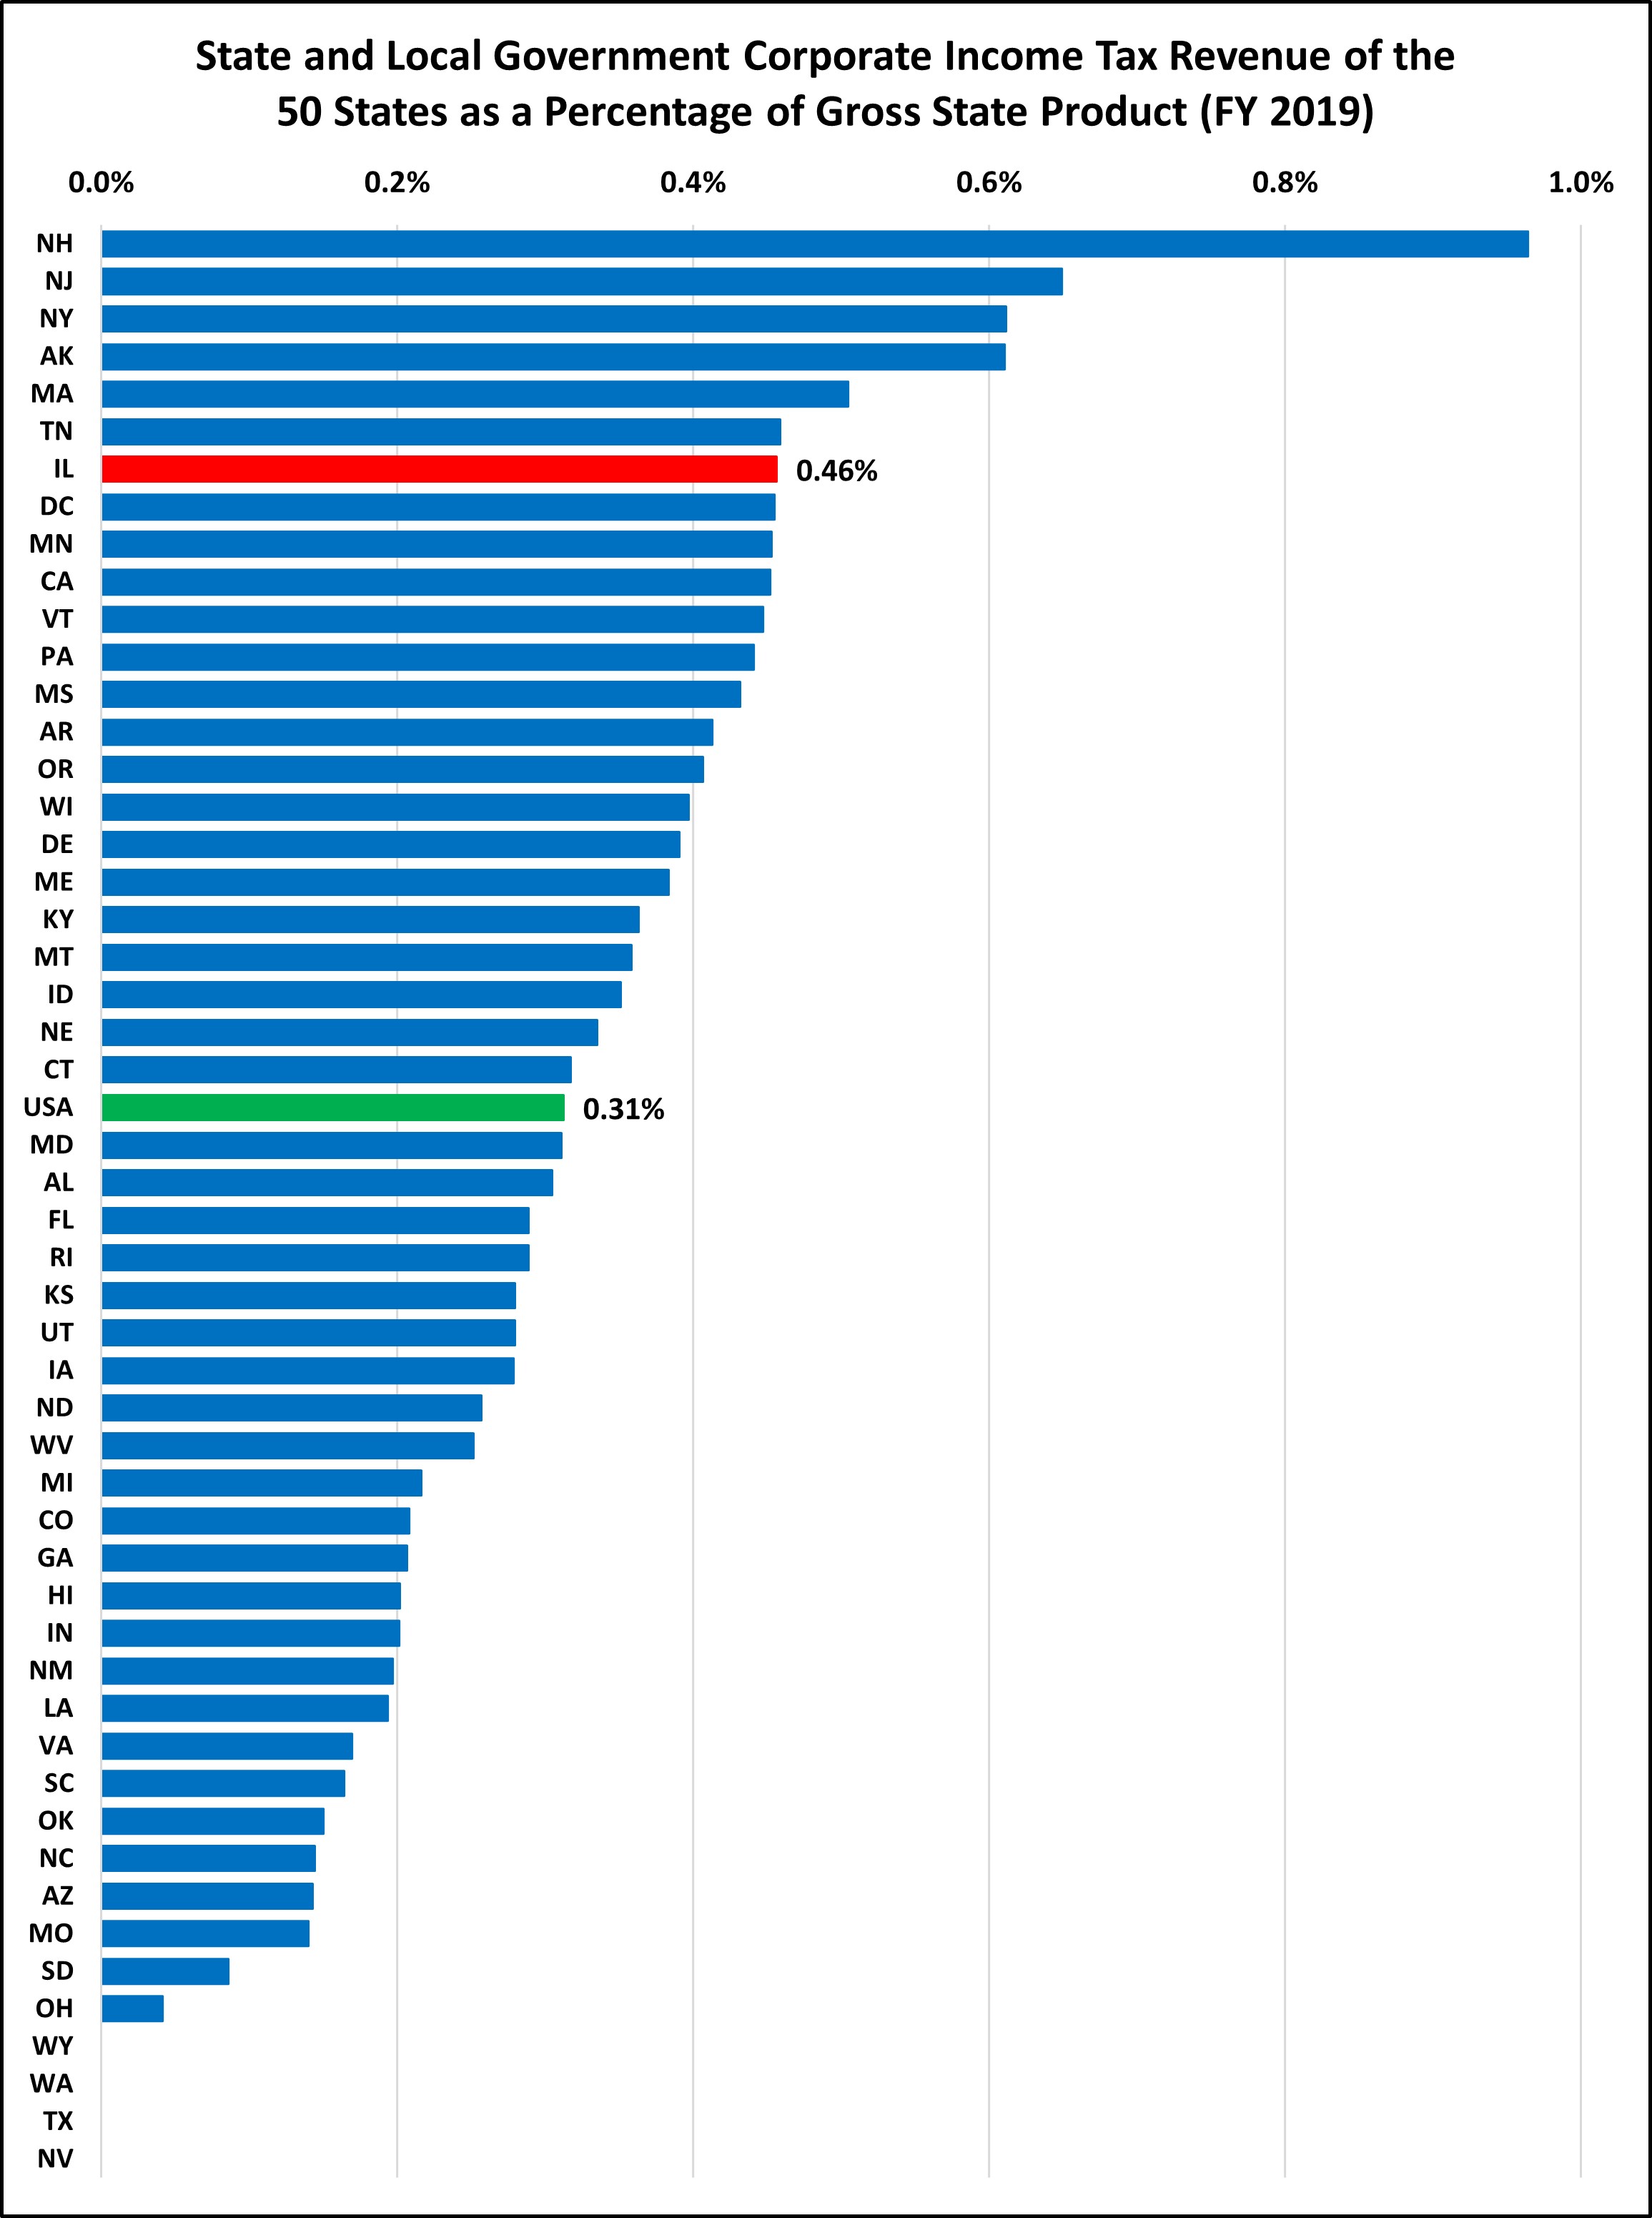 Illinois’ corporate income tax collections are clearly above average, partially due to Illinois’ high corporate income tax rate. This category includes any income taxes imposed on businesses but not individuals, so Illinois’ personal property tax replacement income tax, which is paid by C corporations and certain pass-through entities, is included. Gross receipt taxes, such as Texas’ margin tax and Washington’s business and occupation tax (which are generally considered more like an income tax) are considered a sales tax by the Census Bureau and thus are not included.
CORPORATE INCOME TAXES ARE VOLATILE
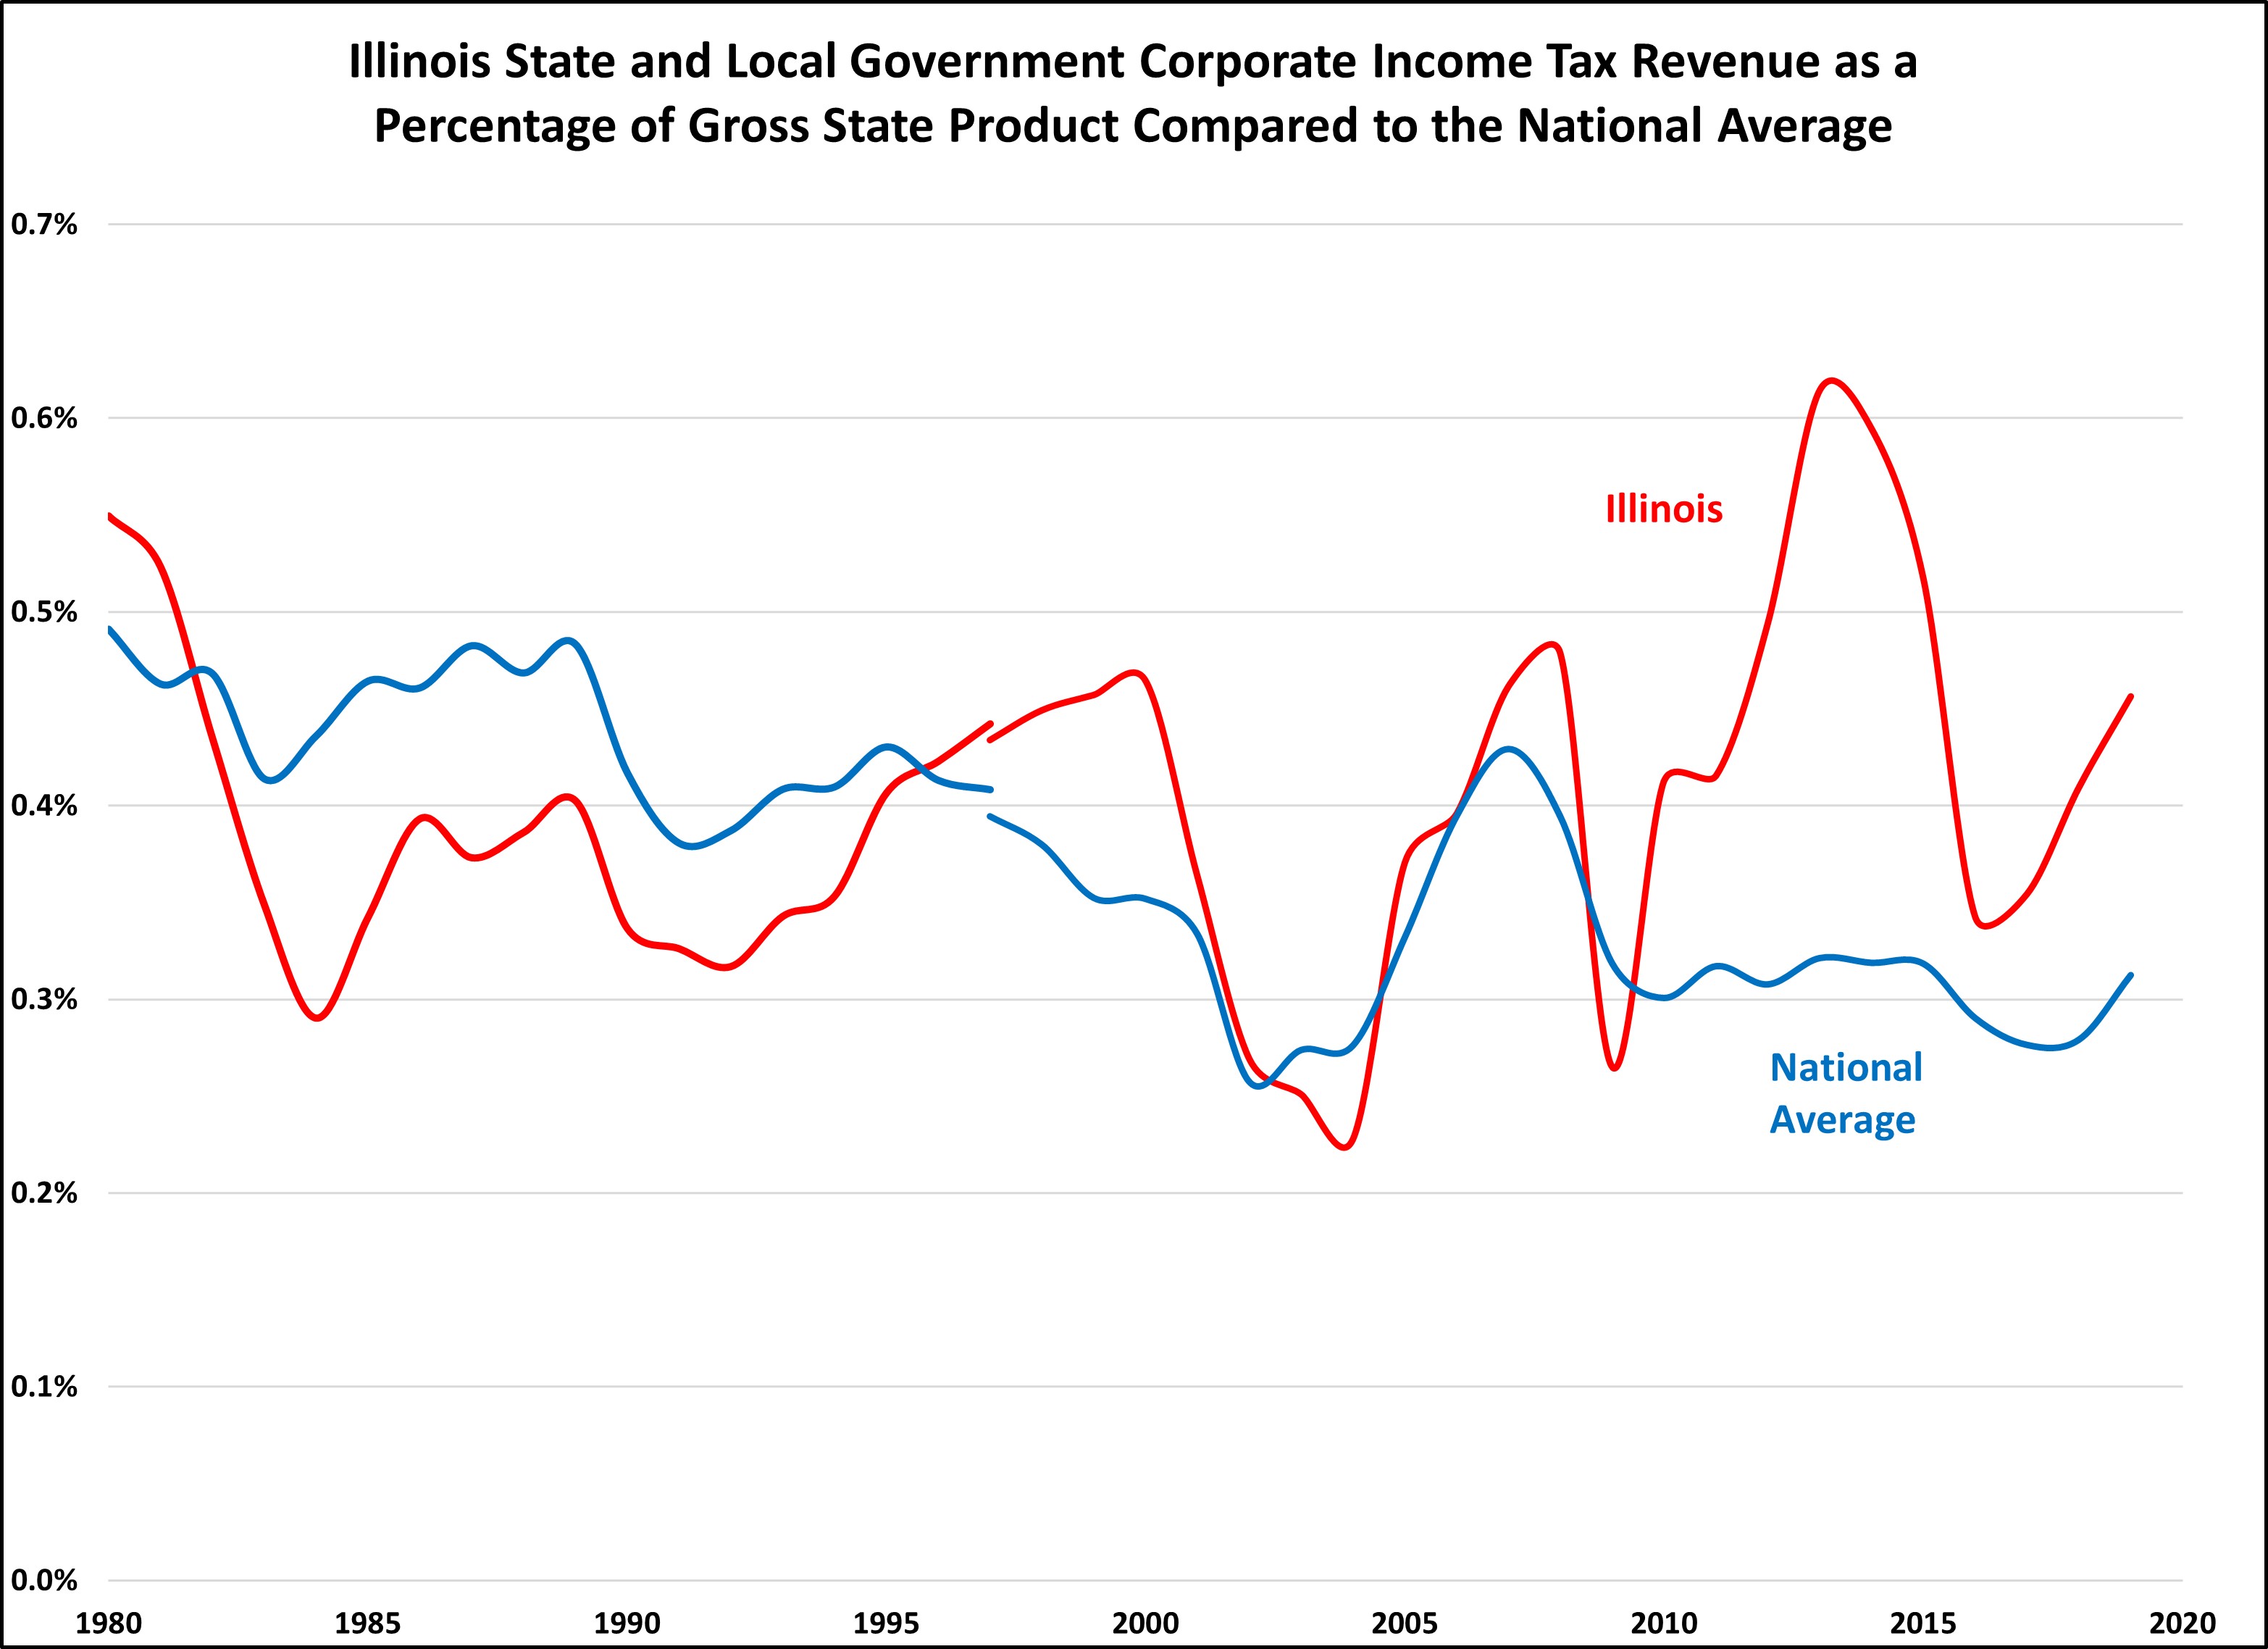
The corporate income tax is one of the most volatile taxes, and as this chart shows, it has been particularly volatile in Illinois in recent years. This is largely due to changes in rates, but the suspension of the net operating loss deduction, and its reinstatement in 2015, was a contributing factor. When comparing states, it is important to look at historical trends; a single year may be an outlier and focusing on it can lead to inaccurate conclusions.
BUSINESSES PAY MORE THAN JUST CORPORATE INCOME TAXES
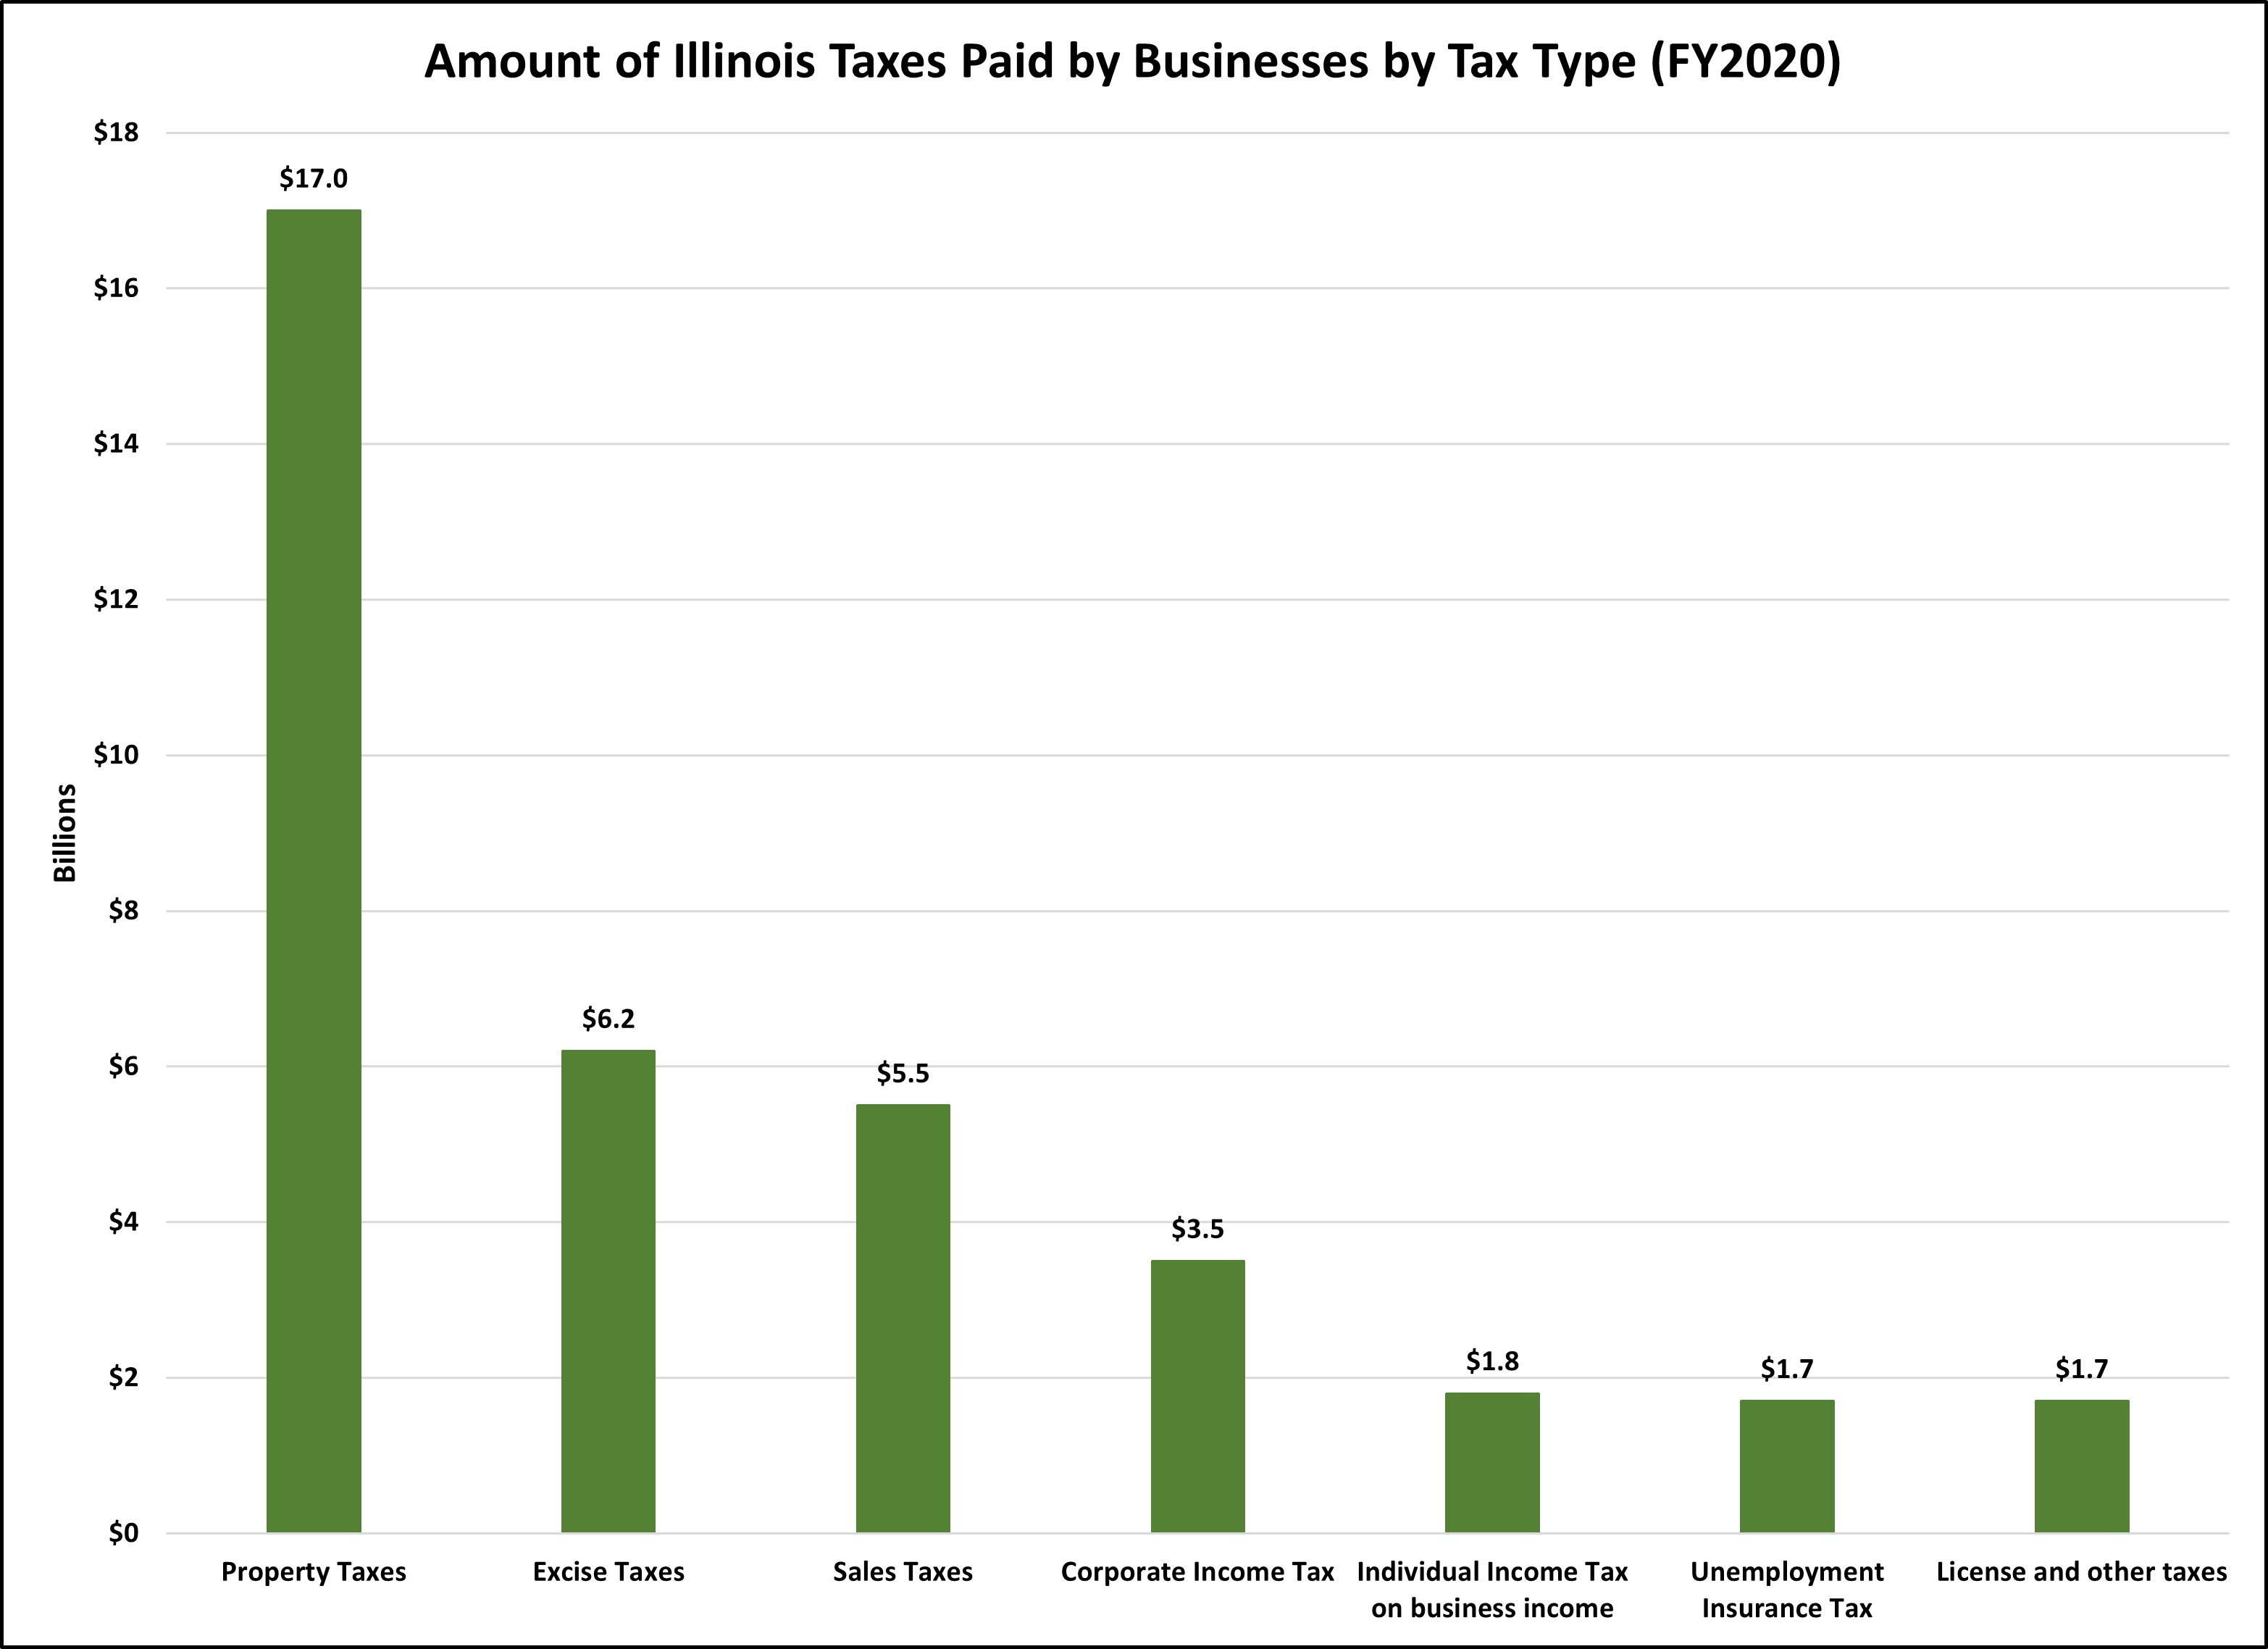
Many people think that state corporate income taxes are the most important or largest tax for businesses, but businesses pay all types of taxes. In reality, property taxes account for nearly half of the taxes businesses pay in Illinois, while the Illinois corporate income tax is only 9.5% of the overall business tax burden in Illinois.
ILLINOIS’ FRANCHISE TAX IS AN OUTLIER
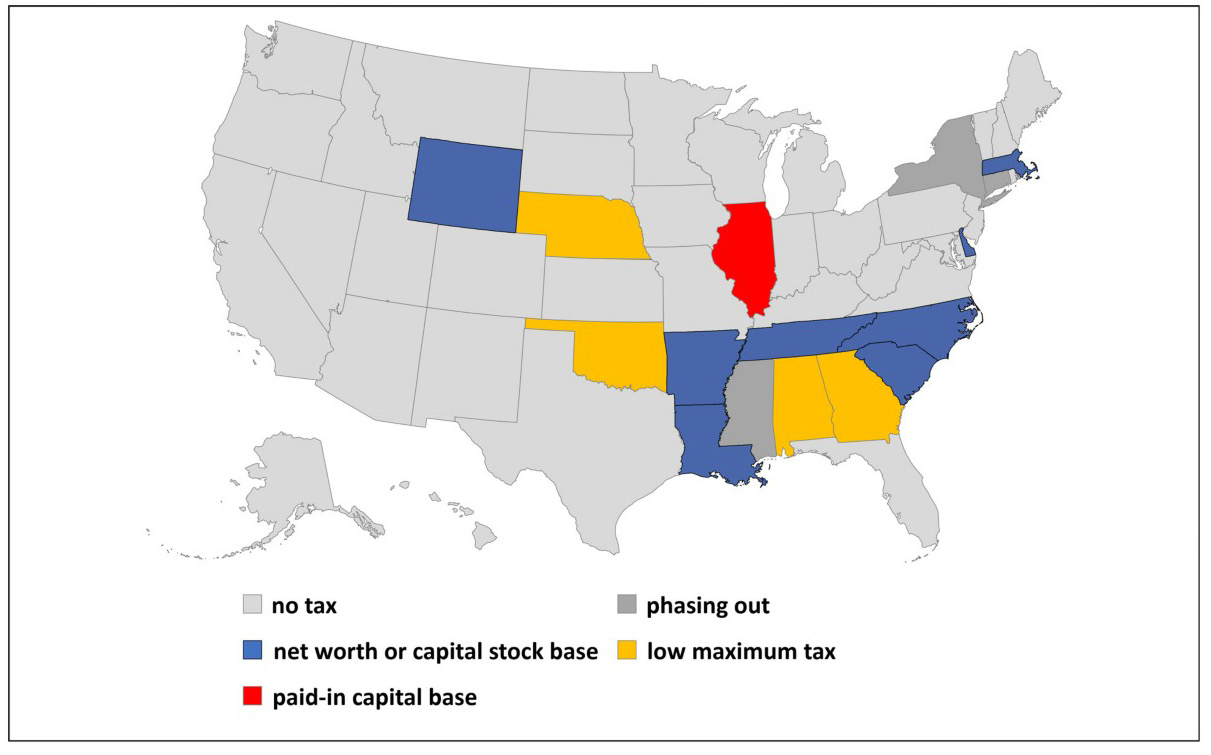
Illinois is one of the few states that still imposes a net worth or capital tax. These taxes typically predate the federal income tax and were frequently temporary-turned-permanent measures to raise revenue from the business community when there was no other means to do so. Most states have since repealed their taxes as they have modernized their tax codes, and as this chart indicates, several others are in the process of doing so. Illinois’ tax was also being phased out, beginning in 2019, but in 2021 the legislature repealed the repeal, effectively reinstating this antiquated tax.
METHODOLOGY
Charts like these are only as good as the underlying data. The charts consistently rely on data from the United States Census Bureau, specifically, the Annual Survey of State and Local Finances. Some states have taxes which do not fit neatly into a category, such as Washington’s Business and Operations Tax, a gross receipts tax on businesses. Some might think it should be classified as a corporate income tax. However, the census classifies it as a sales and excise tax. There are other instances where the Census guidelines and classifications may not be intuitive, but for simplicity and consistency, we follow the Census classifications.
We are aware of flaws in the Census data. The sales tax data for Illinois was incorrect for approximately twenty years. For FY 2018 & FY 2019, there was a mistake with Illinois’ individual and corporate income tax data. The Census will update this figure but until then, we are using the corporate and individual income tax data from the Illinois Comptroller.
Additionally, the Census did not perform the State and Local Government Survey in 2001 and 2003 so data is unavailable for those years.
Despite these faults with the Census data, it is the best data source that exists to compare state and local government taxes.
Data from the Illinois Department of Revenue was obtained from their website or through a Freedom of Information request.
In 1997, the U.S. Bureau of Economic Analysis changed how gross domestic product and gross state product were calculated, resulting in a slightly higher value. This is why there is a break in the historical charts above.
* Maurice Scholten is Legislative Director of the Taxpayers’ Federation of Illinois.