
Income Taxes – How Does Illinois Compare?
Income Taxes
How Does Illinois Compare?
December 2023 (76.6)
People frequently ask how taxes in Illinois compare to those in other states. The story of six blind men and the elephant comes to mind. In the story, each man touched a different part of the elephant: the side, the trunk, a tusk, a leg, an ear, and the tail. Each of the men had very different experiences based on the part they touched. An accurate picture of the elephant was possible only if the men put their experiences together. Similarly, no single chart or figure completely encompasses taxes in Illinois.
In this article, and throughout the series of articles we are publishing comparing Illinois taxes to other states, we will provide a variety of views in order to portray a more complete picture. A few notes on the data we use, before we begin:
- We look at state and local taxescombined. Some states pay for services with state funds, while others leave that funding to local governments and local taxes. Furthermore, a person buying $100 worth of groceries and other household goods usually does not know (or care) who imposed the sales tax on those goods, and which government receives the tax. Comparing the two ensures we are comparing apples to apples.
- Secondly, tax collection rankings should reflect the states’ differing economies (which often reflect different costs of living and income levels). For example, let’s assume States A and B both have a flat income tax rate of 5%, but in State A the median personal income is $50,000, and in State B the median personal income is $55,000. As a result, the median State A resident would pay $2,500 in income taxes and the median State B resident would pay $2,750. Even though the two states have the same rate, the State B resident pays more in absolute dollars, but she also has more after-tax income. Does State B have higher taxes, or are they equal? We would posit that they are equal, but under a per capita comparison, B’s taxes are higher. To avoid this distortion, we look at taxes as a percentage of gross state product (the total value of all goods and services produced within the State) to arrive at the percentage of economic output diverted to taxes, rather than per capita taxes. This measure has the added benefit of not needing to be adjusted for inflation.
- We use the most recent data released by the Census Bureau, which is for FY 2021 (July 1, 2020 – June 30, 2021). This is the second fiscal year affected by COVID-19, which has had a significant impact on everything, including state and local taxes.
INDIVIDUAL INCOME TAXES ARE ABOVE AVERAGE
 Source: Census Bureau, State and Local Government Finances and Bureau of Economic Analysis, TFI Calculations
Some say that income taxes are high in Illinois. This chart shows that individual income taxes as a percentage of gross state product are indeed above average, but not significantly. And there are plenty of states with even higher taxes. It may come as a surprise to see that our neighbors Indiana and Kentucky collect more than Illinois. Keep in mind, however, that an individual’s personal results can vary significantly based on their income level, especially in states with a graduated rate structure.
INDIVIDUAL INCOME TAXES IN ILLINOIS AND NATIONALLY HAVE RISEN

Source: Census Bureau, State and Local Government Finances and Bureau of Economic Analysis, TFI Calculations
For many years, individual income tax collections in Illinois were been below the national average. This changed when rates were increased in 2011. When the rates dropped in 2015, we were once again below the national average. Rates were increased again in 2017, and Illinois returned to above average.
More recently, individual income tax levels have been volatile due to COVID and inflation. While the latest data we have from the U.S. Census is for FY2021, we can use data from the Illinois Comptroller for FY2022 & FY2023. In FY2023, individual income taxes as a percentage of GSP decrease; will this be the trend nationally? Historically, the State and the national average have moved in tandem. So a decrease in the national trend is likely. Additionally, a number of states have decreased income tax rates due to the increased revenue they have been receiving.
One data quirk to note is that after the Illinois Department of Revenue processed the 2021 income tax returns, they determined $1 billion of income taxes paid by businesses should have been categorized as individual income tax revenue. However, we don’t know in which fiscal years that $1 billion was collected so we have made no adjustment to this chart. As a percentage of GSP for Illinois, $1 billion is approximately 0.1% of GSP. So if this $1 billion were included in a single fiscal year, it would increase that amount slightly, but not dramatically. In FY2024, the Department will shift $1 billion of income taxes paid by businesses to individual income taxes to correct this misallocation. So in FY2024, we will see slightly higher individual incomes taxes (and slightly lower corporate income taxes). It should be noted that we do not know yet if the adjustment for tax year 2022 will as significant as the 2021 tax year adjustment.
ILLINOIS’ RETIREMENT EXEMPTION HISTORICALLY HAS GROWN FASTER THAN INCOME

Source: Illinois Department of Revenue, TFI Calculations
All retirement income, whether or not it is taxed by the federal government (and most of it is), is exempt from Illinois income tax. This chart shows the growth in the retirement exemption and the income tax base since 2007 in 2021 dollars, to adjust for inflation. While the amount of income received but not taxed under this exemption grew by almost 60% during this time period, the income tax base grew by less than 20%. However, almost all of the growth in the tax base occurred in 2021, while the size of the retirement exemption remained flat in 2021. As with overall collections, time will tell if this is a shift in the trend, or an anomaly.
ILLINOIS CORPORATE INCOME TAX COLLECTIONS ARE HIGH

Source: Census Bureau, State and Local Government Finances and Bureau of Economic Analysis, TFI Calculations
Illinois’ corporate income tax collections are clearly above average, partially due to Illinois’ high corporate income tax rate (7% corporate income tax rate plus the 2.5% personal property replacement tax rate). This category includes any income tax imposed on businesses but not on individuals, so the personal property replacement tax on partnerships and S corporations is also included. Gross receipt taxes, such as Texas’ margin tax and Washington’s business and occupation tax (which are generally considered more like an income tax) are considered a sales tax by the Census Bureau and thus are not included.
ILLINOIS CORPORATE INCOME TAX COLLECTIONS HAVE INCREASED DRAMATICALLY

Source: Census Bureau, State and Local Government Finances and Bureau of Economic Analysis, TFI Calculations
The corporate income tax is one of the most volatile taxes, and as this chart shows, it has been particularly volatile in Illinois in recent years. We used data from the Illinois Comptroller for FY2022 & FY 2023 for a more up to date picture. The volatility is largely due to changes in rates in 2011, 2015, and 2017, but the suspension of the net operating loss deduction in 2010, its reinstatement in 2015, and a second suspension in 2021 is also a contributing factor. When comparing states, it is important to look at historical trends; a single year may be an outlier and focusing on it can lead to inaccurate conclusions. That being said, Illinois’ corporate income taxes have been significantly higher for the past two years. We will also see what happens to the national average when the U.S. Census data is available. The misallocation of taxes between corporate and individual income tax as discussed on page 3 is equally applicable here, but that $1 billion of revenue is only 0.1% of GSP, so while removing it would lower the Illinois line slightly, it wouldn’t change the overall picture.
DOWNSTATE COUNTIES BENEFIT FROM LGDF DISTRIBUTIONS

Source: Illinois Department of Revenue, TFI Calculations
The State distributes a percentage of income taxes through the Local Government Distributive Fund (LGDF). These funds are distributed to municipalities in Illinois on a per capita basis. The State transfers 6.06% of individual income tax receipts to LGDF. This chart shows how much local governments in each county receive from the individual income tax portion of LGDF for every $1 of individual income tax paid by their residents that is transferred into LGDF (we only look at the LGDF distributions from individual income taxes). In other words, counties that receive more than $1, get more than they put in, and counties that receive less than $1, receive less than they put in. However, the average is $1.12, meaning they would receive $1.12 for every $1 contributed. The average is more than $1 because non-residents contribute to LGDF, but the funds are distributed within Illinois. Generally speaking, residents in Cook and the collar counties get a lower return from LGDF than downstate counties. This is because taxpayers in Cook and the collar counties have higher average incomes, and thus pay higher income taxes and contribute more to LGDF, yet LGDF is distributed on a per capita basis.
PPRT DISTRIBUTIONS SEEM RANDOM
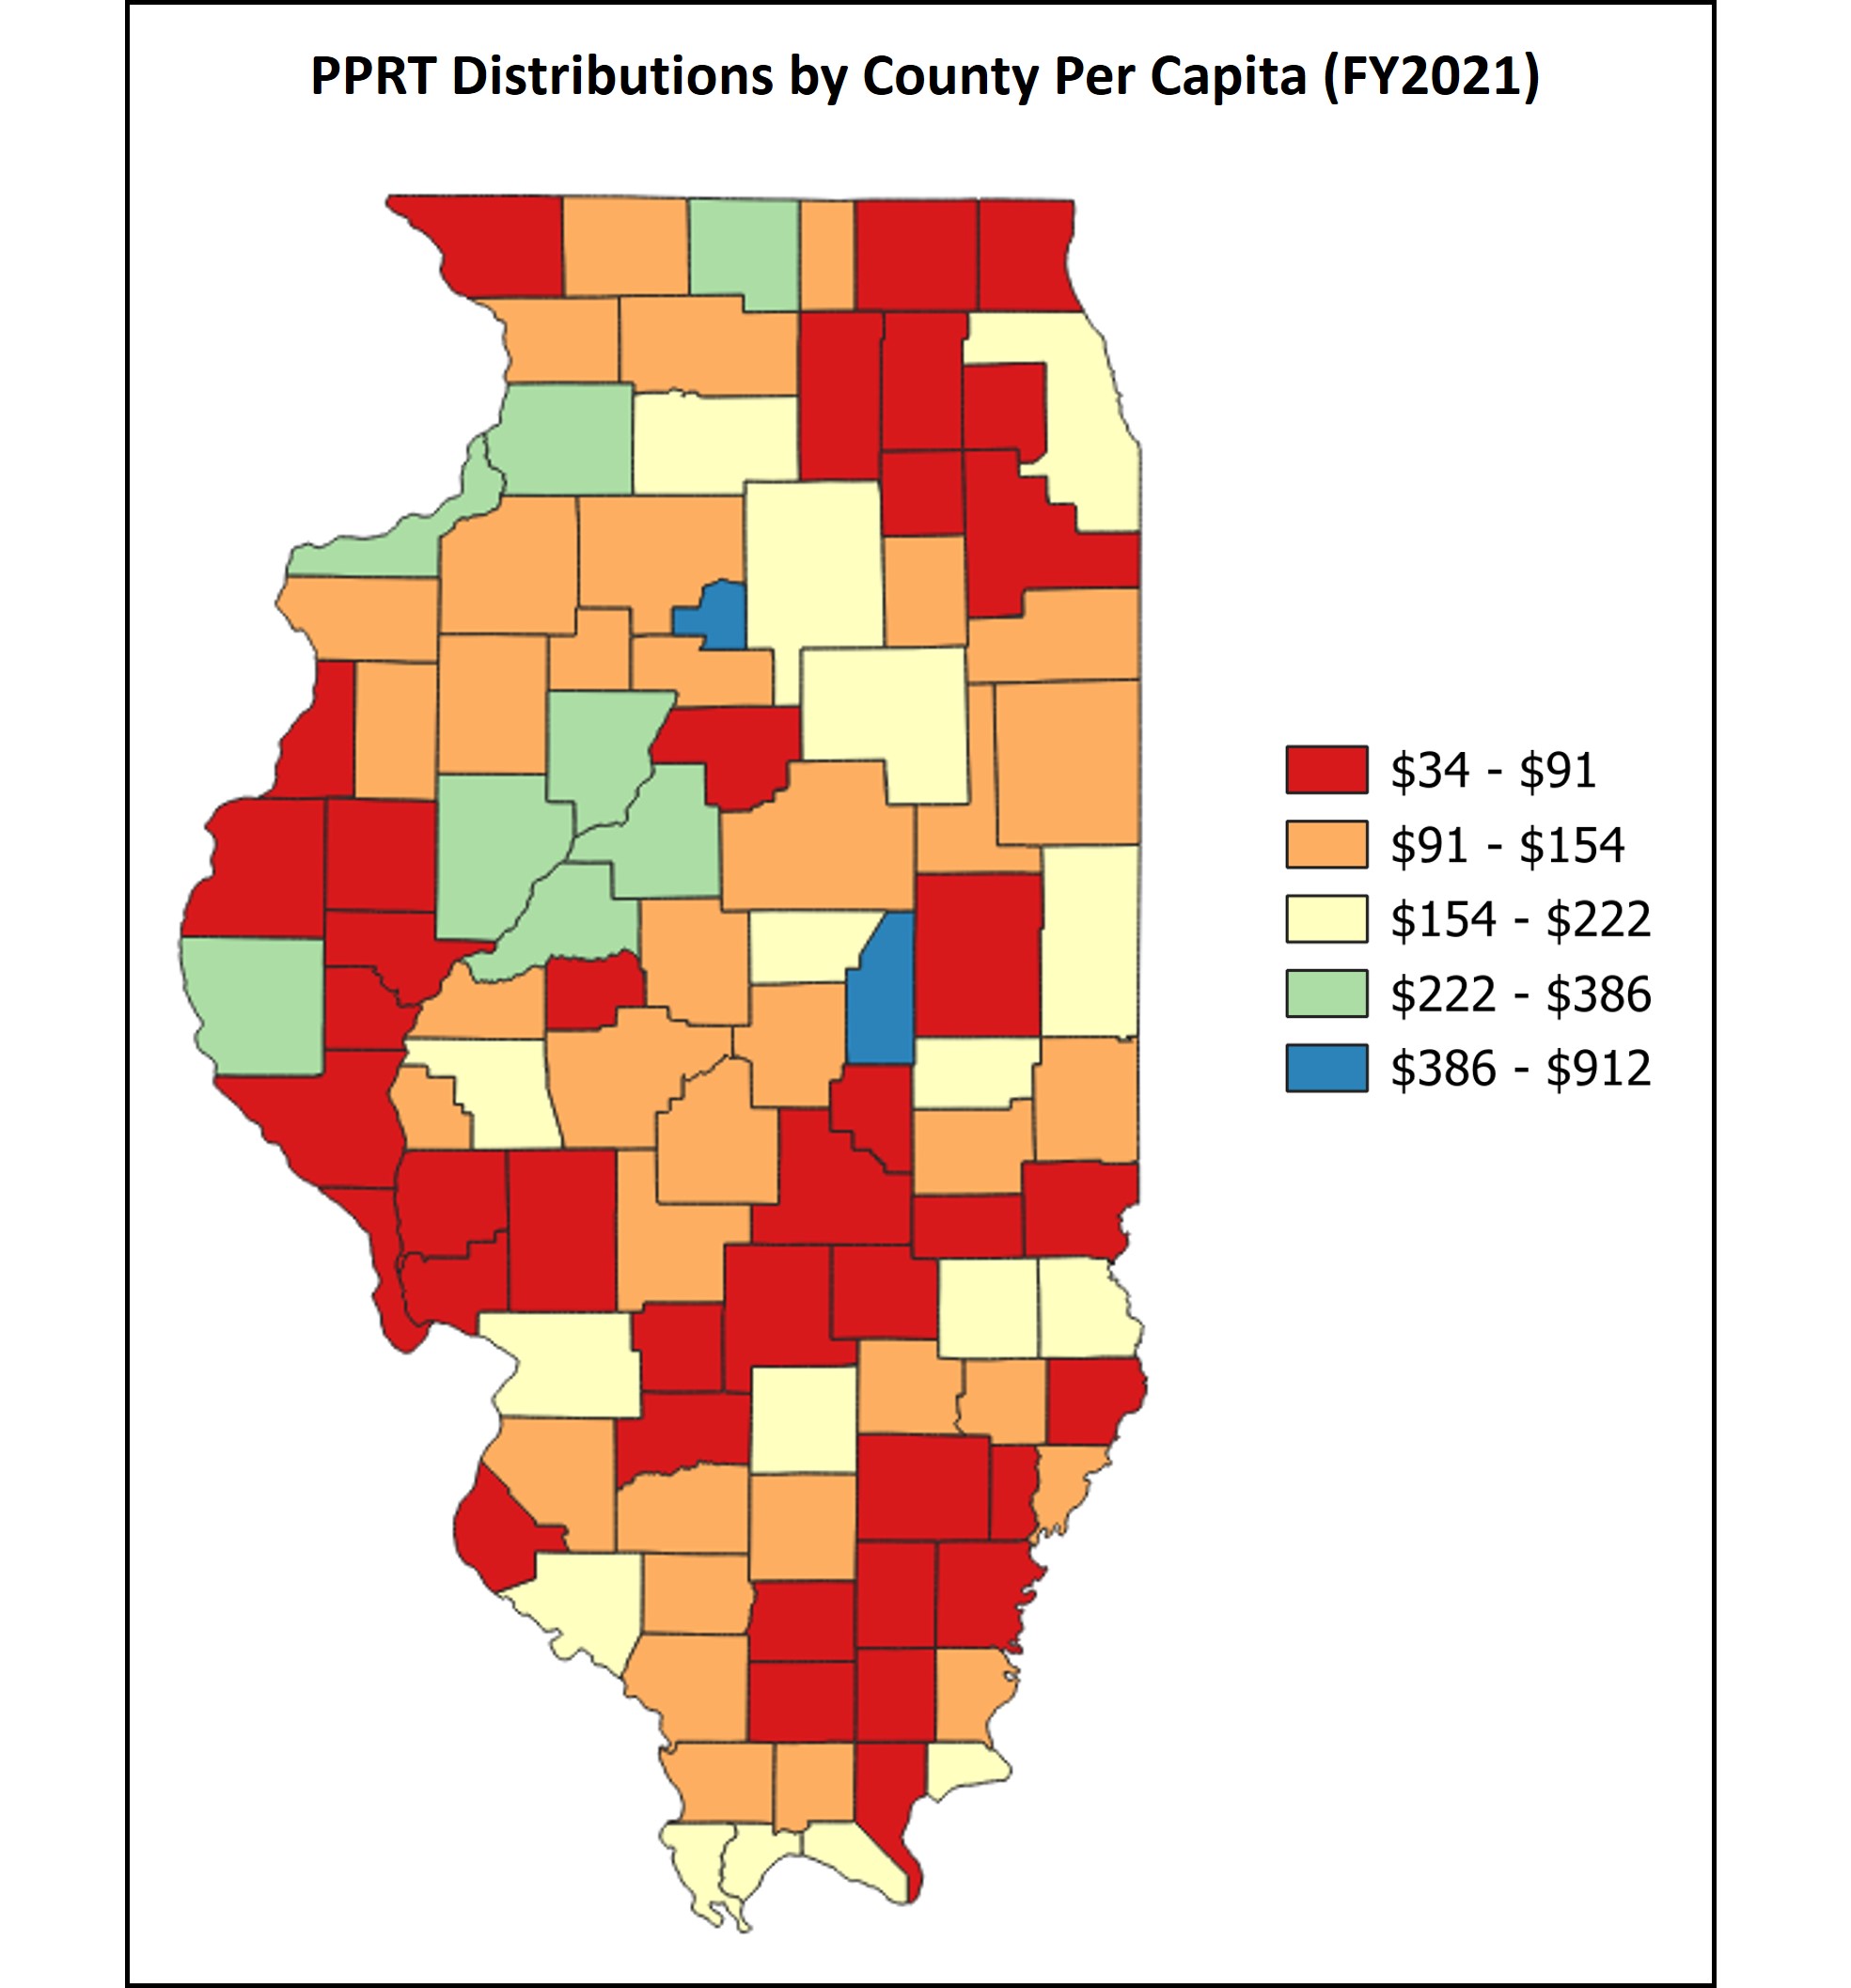
Source: Illinois Department of Revenue, TFI Calculations
The 1970 Illinois Constitution repealed the personal property tax, beginning in 1979, but the General Assembly was required to find a replacement tax for the lost revenue, which ultimately became the “Personal Property Replacement Tax.” The largest piece of this is an income tax on businesses. Local governments in Cook County in aggregate receive 51.65% of the revenues. That amount is distributed to those local governments based on their share of personal property tax collections in 1976. The remaining 48.35% of the revenues are distributed to local governments in the other 101 counties based on their share of personal property tax collections in 1977. This chart shows the per capita PPRT distributions by county for FY2021. The State average PPRT distribution per capita is $144. Seventy two counties receive amounts below the state average. Putnam and Piatt County received $846 and $911 per capita respectively, much more than the state average. While the State has changed significantly since the 70’s, the distribution of the PPRT revenues have not.
ILLINOIS’ FRANCHISE TAX IS AN OUTLIER

Source: Tax Foundation and TFI
Illinois is one of the few states that still imposes a net worth or capital tax. These taxes typically predate the federal income tax and were frequently temporary-turned-permanent measures to raise revenue from the business community when there was no other means to do so. Most states have since repealed their taxes as they have modernized their tax codes, and as this chart indicates, several others are in the process of doing so. Illinois’ tax was also being phased out, beginning in 2019, but in 2021 the legislature repealed the repeal, effectively reinstating this antiquated tax.
1% OF CORPORATIONS PAY 89% OF THE TOTAL CORPORATE INCOME TAX (2020)

Source: Illinois Department of Revenue
From time to time, the statistic that two thirds of corporations don’t pay Illinois income taxes is cited with alarm, suggesting businesses aren’t paying their “fair share” of tax. In 2020, it was actually 72%, as indicated in the chart above. However, what is not mentioned is that 1% of corporations (or 1,222) pay 89% of the corporate income tax in Illinois. A big reason for this disparity is the popularity of pass-through entities, which are taxed on the individual level. This results in large businesses paying the corporate income tax and smaller and mid-size businesses paying individual income taxes. In 2020, while 109,000 businesses filed corporate income tax returns (most of which did not do significant business in Illinois which is why they don’t owe income tax), there were 450,000 businesses that filed as pass-through entities.
METHODOLOGY
Charts like these are only as good as the underlying data. We consistently rely on data from the United States Census Bureau, specifically, the Annual Survey of State and Local Finances. Some states have taxes which do not fit neatly into a category, such as Washington’s Business and Operations Tax, a gross receipts tax on businesses. Some might think it should be classified as a corporate income tax. However, the census classifies it as a sales and excise tax. There are other instances where the Census guidelines and classifications may not be intuitive, but for simplicity and consistency, we follow the Census classifications.
We are aware of flaws in the Census data. The sales tax data for Illinois was incorrect for approximately twenty years. Recently, there has been a mistake with Illinois’ individual and corporate income tax data. We use corporate and individual income tax data from the Illinois Comptroller until the issue with the U.S. Census is resolved.
Additionally, the Census did not perform the State and Local Government Survey in 2001 and 2003 so data is unavailable for those years.
Despite these faults with the Census data, it is the best data source that exists to compare state and local government taxes to compare state and local government taxes throughout the country.
In 1997, the U.S. Bureau of Economic Analysis changed how gross domestic product and gross state product were calculated, resulting in a slightly higher value and causing a break in the historical chart above.