Illinois School Funding: Property Tax Reliance Down, but New Demands for State Funds Loom – Mike Klemens
Illinois School Funding: Property Tax Reliance Down, but New Demands for State Funds Loom
July 2020 (73.5)
by Mike Klemens*
Local property tax contributions to public school funding are 50 percent of the total, according to an Illinois State Board of Education (ISBE) report. The same report puts state funding at 40 percent, the highest level in 18 years. A separate – and more widely cited – ISBE report says that property taxes account for 61 percent of school funding while the state’s contribution is at 27 percent.
Neither report is wrong, as we’ll get to later. However, the different pictures the two reports paint illuminate the complexity and confusion surrounding the historic question on Illinois school funding: What share should be covered by local property taxes and what share should the state cover? In this article we will try to unravel Illinois school funding, compare Illinois with other states, and take a peek at where school funding is headed in Illinois.
State, Local and Federal Resources
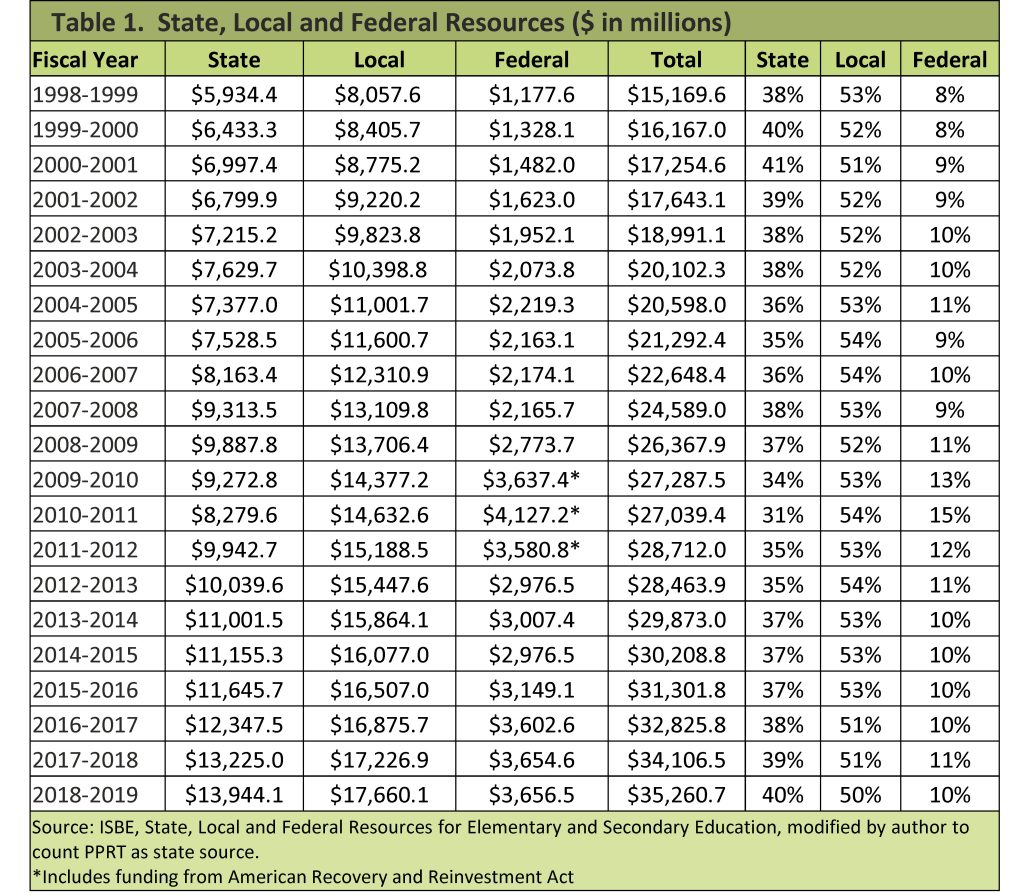
Let’s start with the statutorily required report published by the Illinois State Board of Education, “State, Local and Federal Resources for Elementary and Secondary Education.” (We’ll call it the “Resources Report”.) The report has been around for nearly 50 years. For the 2018-2019 school year, it put state funding at 38 percent, local funding at 52 percent (50 percent property tax), and federal at 10 percent.
State resources in this report include all appropriations made by the state, including contributions to the Teachers’ Retirement System, a line item in the state budget. Local resources include property tax receipts and Personal Property Replacement Tax distributions from the State, but do not include income from investments, food services, or fees.
The longevity of the Resources Report can lead to some confusion. Before Illinois abolished the tax on personal property in 1979, local property tax included tax imposed on both real and personal property. To maintain consistency with earlier years, the state-imposed Personal Property Replacement Tax (PPRT) enacted in 1979 to replace the revenues lost when personal property taxes were abolished continues to be reported as a local tax, though broken out separately.
As a result, the PPRT gets counted as local in the state/local/federal breakdown, even though it is governed by state statute and collected by the Department of Revenue on various state tax returns (primarily a surcharge on business income tax returns) and distributed directly to schools and other local governments. Accordingly, we have moved the PPRT from the local to the state column, boosting the state share and reducing the local share by about 2 percent per year.
A couple of asides here.
1 – The state share would be a fraction of a percentage point higher if PPRT money had not over the last eight years been diverted to pay for items previously covered by other state funding, things like community colleges, local health departments and county officer stipends. Public schools’ share of the diversion from PPRT would be about $150 million.
2 – PPRT receipts have not kept up with property tax growth. When the PPRT was first imposed, after the phase in period, PPRT on average was 8 percent of real property taxes; for the last five years the average has been 4.2 percent. However, even though Illinois taxes only real property, its collections on a relative basis are higher than in states that continue to tax both real and personal property (See TFI’s Tax Facts: An Illinois Chartbook), suggesting that real property taxation may have more than made up for lost revenues from the old personal property tax.
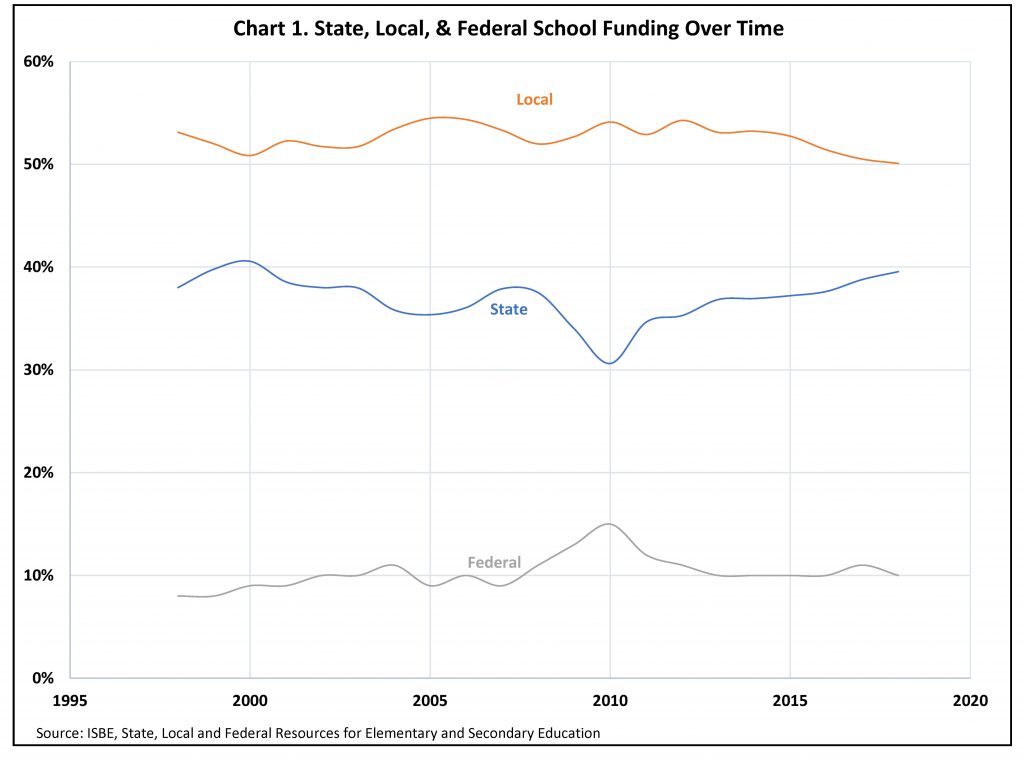
Table 1 shows our modified version of the Resources Report data in which we have shifted the PPRT funds from the local column into the state column, and Chart 1 illustrates how the relative share of funding by state, local, and federal governments has changed over time.
Illinois Report Card
The Illinois Report Card has provided information on state vs local funding for more than 15 years, compiling data from school districts’ audited financial reports filed annually with the Illinois State Board of Education. The latest data, for the 2017-2018 school year, presents a very different picture than does the Resources Report. The property tax share is 20 percent higher, while the state contribution is one third lower.
The big difference between the two ISBE reports is that the Illinois Report Card – compiled from local districts – does not include contributions that state government makes to the Teachers Retirement System (“TRS”) to cover the pensions of teachers, except for those in Chicago public schools. The Report Card does, correctly, report PPRT money as a state revenue source. And it includes fees, interest and other income that the Resources Report does not include.
Since 2002 the Report Card data shows that the property tax share of school funding has increased from 55 to 61 percent, while the state share has fallen from 31 percent to 27 percent. The latest state/local/federal breakdown is 27 percent state, 66 percent local, and 7 percent federal.
Table 2 shows 15 years of property tax, state, local and federal funding from Report Card data.
![]()
Differences
While the Resources Report shows a slight increase in the state share of funding for schools over the last 20 years, the Report Card shows state funding declining. The main difference between the two is the TRS contributions. While school districts do not see that money directly, it is undeniably a state payment towards the cost of providing K-12 education in our public schools (and a payment that most benefits districts paying the highest salaries). Over the last four years, according to our modified analysis in Table 1, the average increase in state funding to schools has been about $700 million per year. More than one third of that has gone to TRS as Illinois makes up for past underfunding of its pension systems.
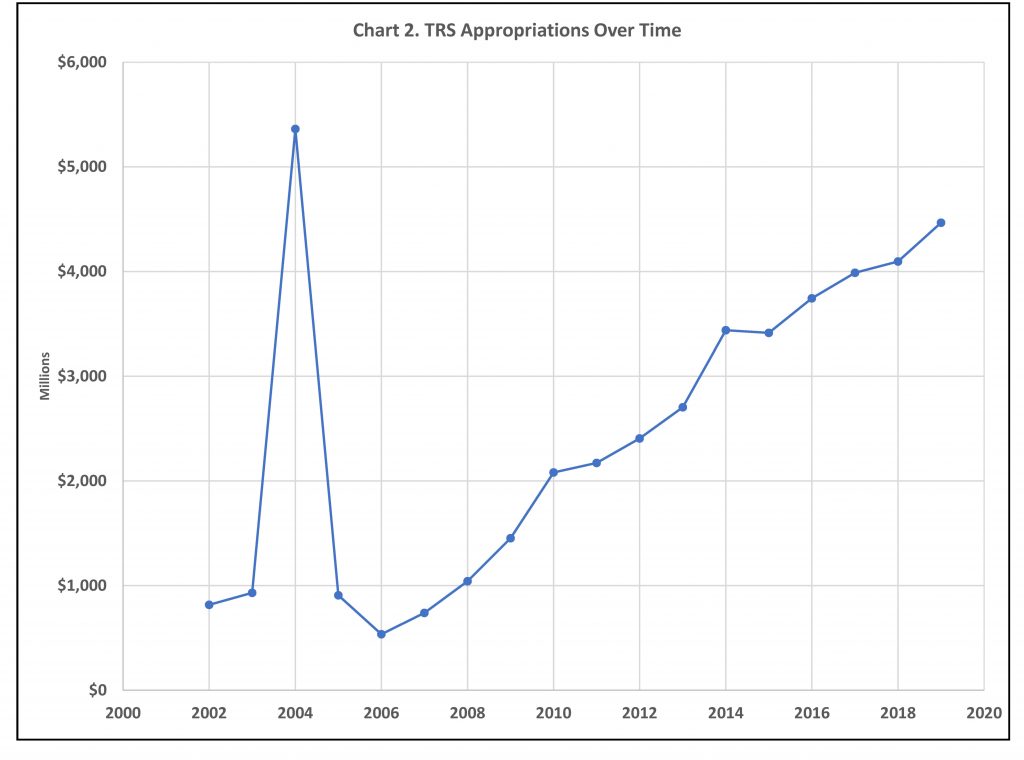
Chart 2 shows Illinois’ state-level contributions to the Teachers’ Retirement System. The jump in 2004 reflects the sale of Pension Obligation Bonds.
National context
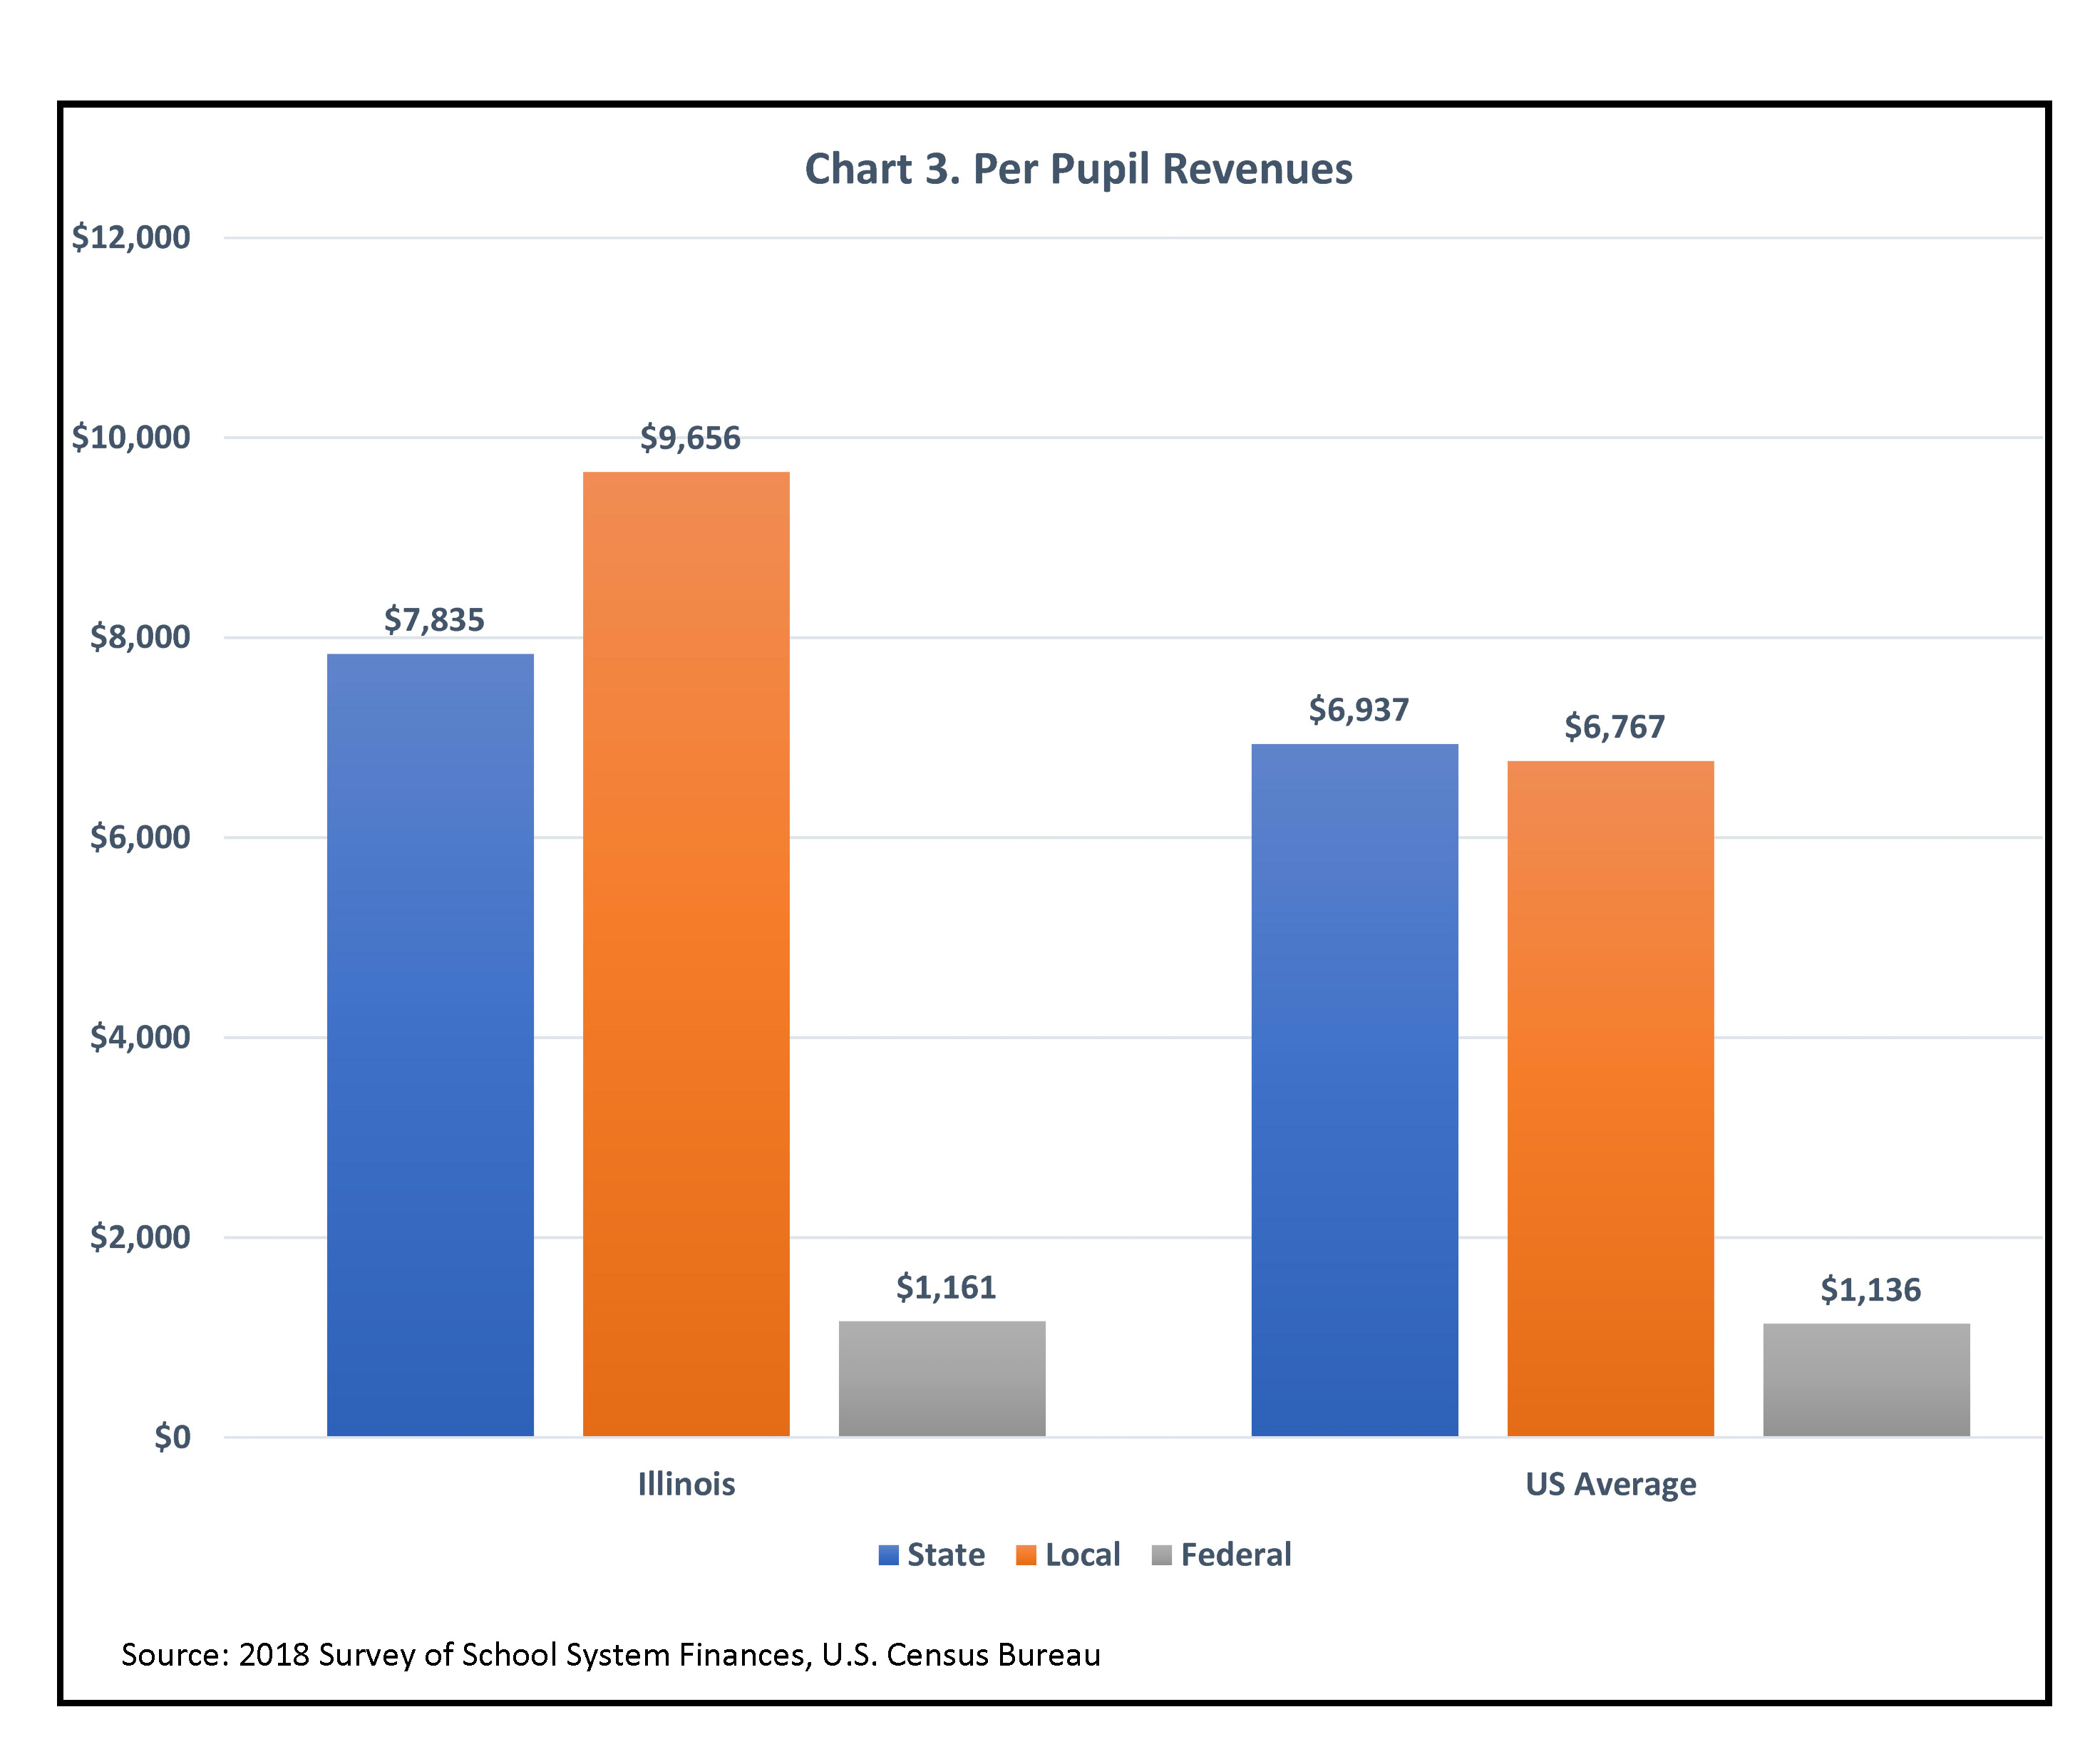
According to the U.S. Census Bureau, Illinois school districts’ per pupil revenues for elementary and secondary education stood 11th highest in the country, at $18,652 compared to a U.S. average of $14,840. Illinois’ total revenues were higher than all neighboring states. In revenues from state sources Illinois stood 18th, about $1,000 above the U.S. average. (The Census Bureau counts both retirement contributions and PPRT as state sources.) In revenues from local sources Illinois stood ninth, about $3,000 above the U.S. Average and above all neighboring states. The census data shows Illinois more reliant on property tax and less reliant on state funding than the U.S. average. For Illinois the state/local/federal breakdown was 42/52/6; the U.S. national average breakdown was 47/46/8.
It is worth noting, when comparing Illinois to other states, that Illinois has a much larger economy than our neighbors and more ability to fund schools. See “Tax Facts: An Illinois Chartbook – The Economy of Illinois,” Tax Facts, June 2020.
Chart 3 shows Illinois and national averages for state, local and federal contributions to school funding.
Future
In 2017 Illinois adopted a new method of allocating school funding, intended to reduce inequities among school districts, called the Evidence-Based Funding (EBF) formula. The new EBF formula calculates the state money each district needs to meet an adequacy target – the money the state has determined to be needed to provide the education required by state law – taking into account district size, poverty levels, needs for non-English speakers and special education needs, together with the money the district can raise locally.
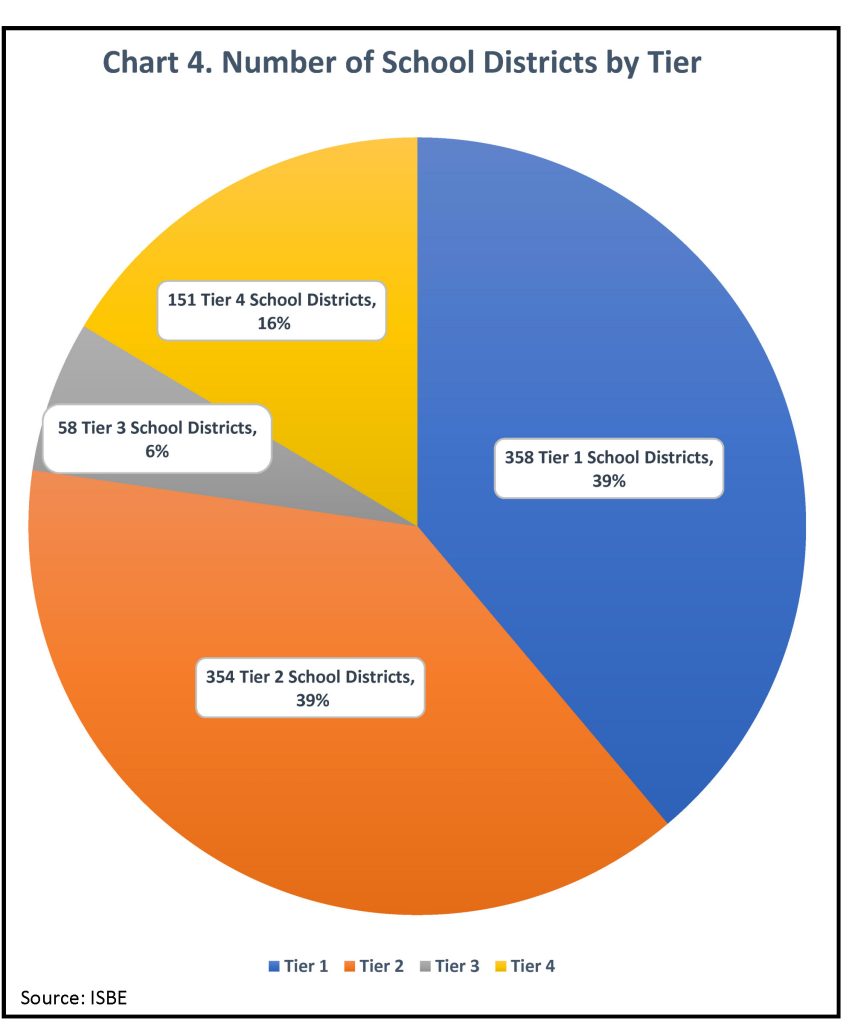
As part of the new program, Illinois was expected to provide an additional $300 million per year in new state aid, plus another $50 million for property tax relief. For FY 2020, Tier 1 districts had less than 67 percent of resources to meet their adequacy target; Tier 2 districts had between 67 and 90 percent of resources; Tier 3 districts had between 90 and 100 percent of needed resources; and Tier 4 districts had 100 percent or more of needed resources. The new formula directed new funds to the schools whose local capacity was farthest below the statute’s adequacy target. Chart 4 illustrates Illinois school districts by tier.
However, the new law did not provide for the new funding, and progress toward closing the funding gap has been slow. According to ISBE calculations the “positive funding gap” (the money needed to bring all districts up to the adequacy target) was $7.37 billion in FY 2018, $7.35 billion in FY 2019 and $7.13 billion in FY 2020. The targets rise as costs rise each year.
Conclusions
- Illinois’ local property tax contribution to school funding, as a percentage of overall school funding, is at its lowest level in 20 years.
- Not surprisingly, state funding of local schools, again as a percentage of overall funding, is at the highest level since FY 2001, the last time Illinois’ budget was balanced under the Comptroller’s budgetary balance concept.
- A significant portion of that increased state funding is going not to schools for current educational needs, but to make up for past underfunding of teachers’ pensions.
- When payments into the teachers’ pension plan is included, Illinois’ per pupil funding for education exceeds both the national average and all surrounding states.
- Nevertheless, the new Evidence-Based Funding formula calculates a need for an additional $7.1 billion to properly fund the current operation of Illinois’ schools. This, plus the ongoing need to reduce the backlog of unpaid bills, will put pressure on state spending for future years, especially in the wake of the COVID-19 pandemic.
*Mike Klemens is the Founder of KDM Consulting Inc., and does tax policy research for the Taxpayers’ Federation of Illinois.