Cook County Property Tax Assessment Reform: The Perfect Storm of Who Pays What? – Mike Klemens
Cook County Property Tax Assessment Reform: The Perfect Storm of Who Pays What?
December 2020 (73.7)
by Mike Klemens*
Following the issuance of the first tax bills that reflect assessments completed by Assessor Fritz Kaegi, Cook County is experiencing the perfect storm in property taxation. The storm has: (1) an assessor elected on and pursuing a reform agenda, (2) assessments that are not (and traditionally have not been) uniform, (3) business property owners who already pay taxes based on a higher percentage of their value than do homeowners in Cook County or businesses in neighboring counties, (4) a system that few understand, and (5) a pandemic that has upended the economy. For individual property owners, what matters is how much they pay, but, as illustrated by the reaction to recent tax bills, by the time property owners get their bills it is too late to do anything about it. Business property owners saw the largest increases in tax bills after the North Triad was reassessed, and fear a repeat when Chicago is assessed next year. In this article, we will try to piece together: (1) the situation Assessor Kaegi inherited, (2) the effects of the 2019 reassessment, and (3) a look forward.
Basics – Dividing up the bill
The concept behind the property tax is simple; the assessment process divides up tax bills based on the value of property (invoking the concept of relative share). Take a simple example, a hypothetical taxing district with two properties – House A valued at $100,000 and House B valued at $200,000 – whose only function is to maintain a gravel road. If the annual regrading and re-graveling of the road costs $3,000, the taxing district would impose a 1 percent tax. House A would pay $1,000 and House B $2,000.
If there were a real estate boom and the values of the two houses in our example doubled, the tax rate would be cut to 0.5 percent and the bills would be unchanged. Conversely, if there was a real-estate crash and the values of both houses were cut in half, the tax rate would double to 2 percent and both property owners would pay the same amount. It’s all about relative share.
Only two things change the homeowners’ bills: (1) if the cost of maintaining the road goes up the bills will too. If the annual cost rises to $3,300, House A would pay $1,100 and House B would pay $2,200 (the relative shares stay the same); or (2) a change in relative values – If homeowner A put on a big addition increasing House A’s value to $200,000, House A’s bill would increase to $1,500 while House B’s would drop to $1,500.
What seems straightforward in our over-simplified example gets complicated in the real world. Cook County has 1.8 million parcels of property, some assessed at 10 percent of market value and others at 25 percent. Further complexity comes from homestead exemptions of varying sizes on owner-occupied residences. Finally, along comes the state issuing a multiplier to bring the overall level of assessment in the county be 33.3 percent of market value. No wonder it’s difficult for a property owner to determine her/his relative share.
Cook is Different
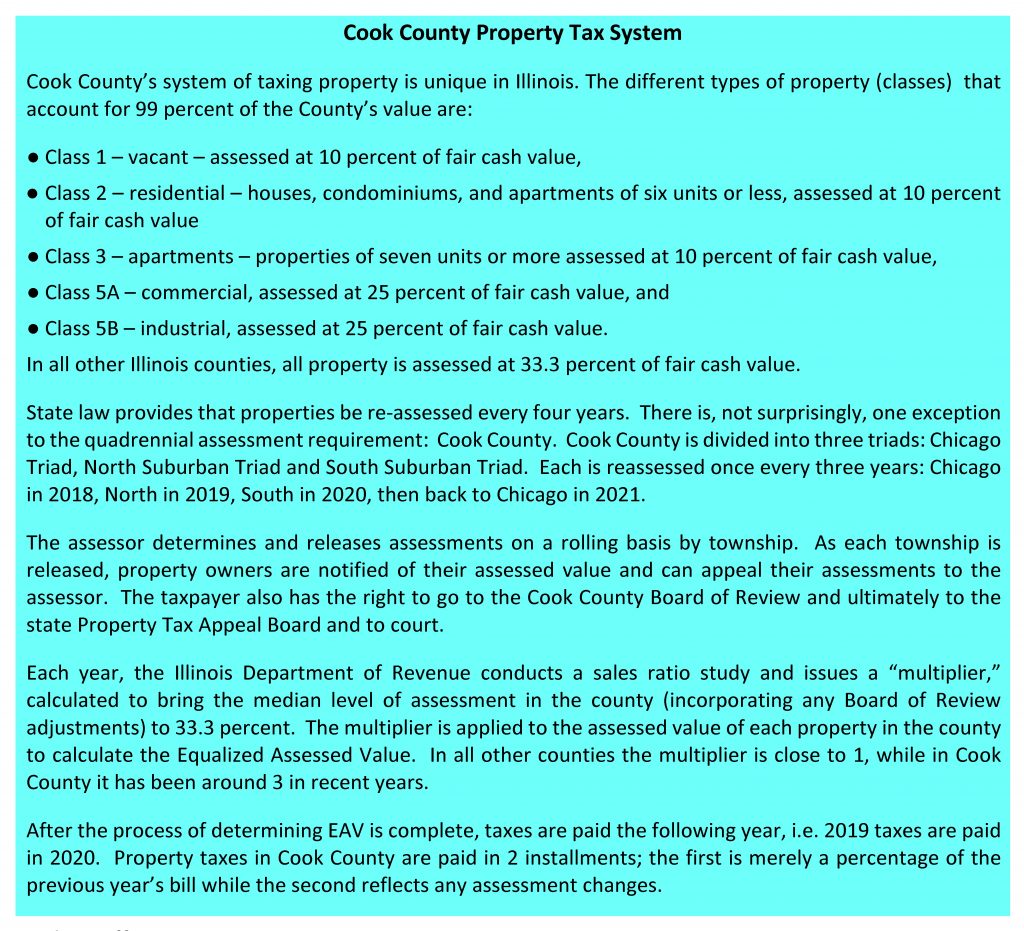
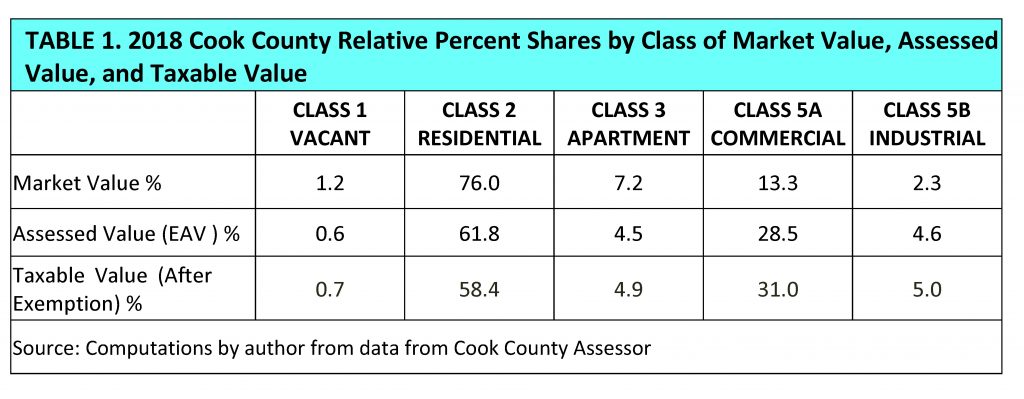
We have two different property tax systems in Illinois, Cook County and everywhere else. As authorized by the Illinois Constitution, Cook County classifies property. See Cook County Assessment Process above. The effect of Cook’s classification is to shift tax burden off residential property owners onto commercial and industrial properties. The shift and the effects of classification and of homestead exemptions are illustrated in Table 1,which uses data from the Department of Revenue’s 2018 sales ratio studies to project for the various classes the market values, equalized assessed values, and the equalized assessed values after homestead exemptions. From the data, residential (Class 2) property comprises 76 percent of market value and 58 percent of taxable value. On the other hand, commercial property comprises 13 percent of the market value, but 31 percent of the taxable value. Both classification and homestead exemptions account for the shift onto commercial and industrial property.
Cook County’s triad system is also unique. Each is reassessed once every three years and then the assessments remain unchanged for two years, except for the state multiplier. The result is that, in any given year, the assessments in two of the three triads will be out of date, which can have an impact when property values are changing rapidly.
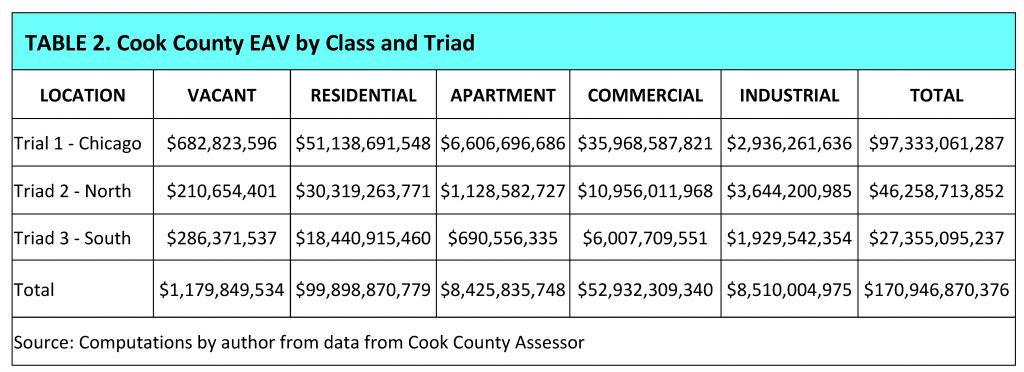
The Chicago Triad has the most property value and the south suburbs the least. Chicago has more than half the residential (Class 2 defined as six units or fewer), nearly 70 percent of the commercial property value, and 80 percent of apartment value. Table 2 gives the 2018 EAV by Triad and class of property.
Cook County property owners are also a litigious bunch. The Cook County Board of Review annually hears 400,000 challenges to assessments. And at the state level, Cook County has 40 percent of the state’s population but accounts for nearly 80 percent of the challenges at the Property Tax Appeal Board.
Historical Context
Before we start, let’s look back. In Cook County and all across Illinois, property values boomed and grew 7 to 9 percent a year from 2000 to 2009. Then came the real estate crash and values tumbled for four consecutive years, falling nearly 25 percent between 2009 and 2013. Total Cook County property values have still not climbed back to their pre-crash levels.
Outside View
The annual sales ratio study conducted by the Illinois Department of Revenue offers an outside view of the assessments in Cook County. The study is part of a statewide process of equalizing assessments so that they meet the Constitutional requirement that property tax be “levied uniformly by valuation.” The department is charged to bring the level of assessment in each county to 33.3 percent of market value.
A strength of the study is that it is a purely ministerial function whose results have no cost or benefit to state government, and the methodology has remained unchanged over the years. The department’s studies were challenged and upheld by the Supreme Court in Airey v Department of Revenue in 1987 and Advanced Systems, Inc. v Johnson in 1989.
A weakness of the study for policymakers is that the study looks backward, so lags what is happening in real time. To conduct the sales ratio study the department starts with sales price and assessed value data on the Real Estate Transfer Declarations filed with each property sale. They exclude the value of personal property included in the sales price and throw out sales between related individuals or companies and those with other factors indicating that a sale was not an arms-length transaction between a willing seller and a willing buyer.
For each arms-length sale, for the five classes of property on which they do the Cook study (vacant, residential, apartment, commercial and industrial) they compute an assessment sales ratio by dividing the previous year’s assessed value by the sales price. They do this so an assessor can’t do selective reappraisal (sales chase) and only reassess properties that sell to show a higher level of assessment and receive a lower multiplier. The result is an assessment sales ratio. They array those ratios for the properties in each of the five classes from high to low and the one in the middle is the median ratio. Then, to account for using the previous year’s assessment, the department adjusts the current median ratios by any reassessment done in the sale year.
The latest study, reflecting the status of assessments when Kaegi became assessor, compared 2018 sales to 2017 assessments and then adjusted the median levels for 2018 reassessments. Two points pop out:
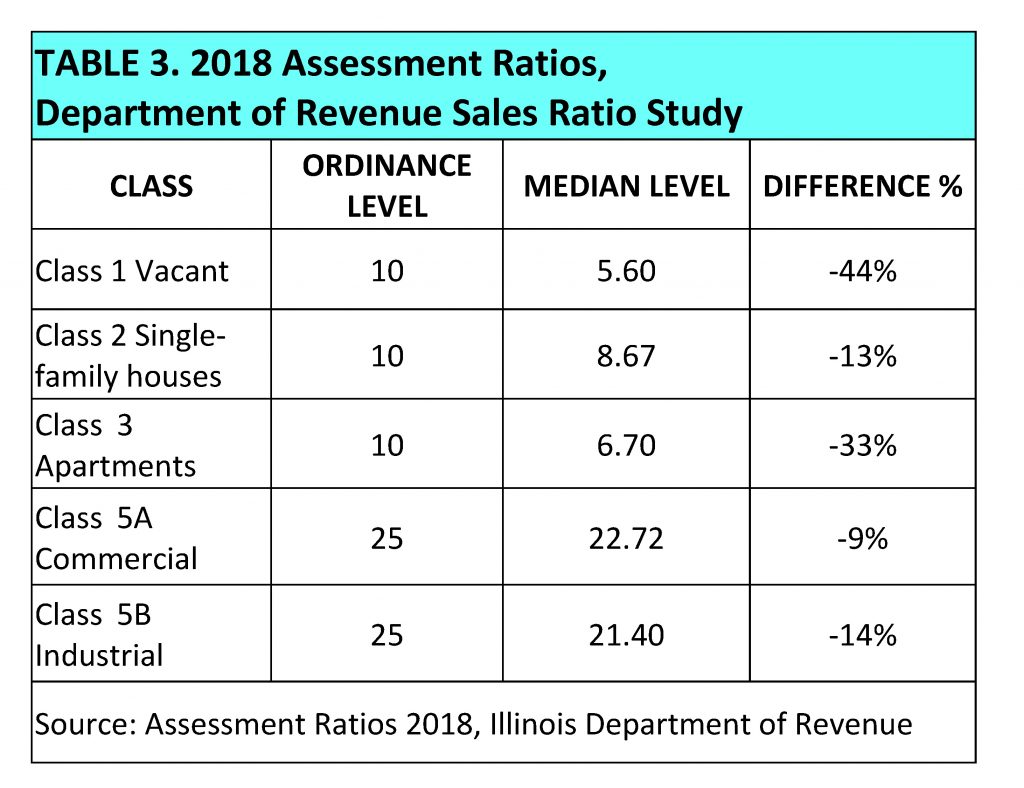
(1) All five classes of property were underassessed. Table 3 shows the statutorily mandated “ordinance level” of assessment and actual countywide median assessment levels for each class. This is not shocking because, when property values were increasing, the South Triad assessments were one year old and the North Triad two years out of date in 2018.
(2) Assessments are not uniform, with assessments of commercial, industrial and apartment properties particularly bad. The Coefficient of Dispersion (a statistical measure of the average assessment error) exceeded 50 percent in those classes, standing at 51 percent for both industrial and commercial and 55 percent for apartments. The residential/COD was 23 percent.
It’s worth noting that the lack of uniformity is nothing new. The 2000 sales ratio study, before the beginning of the real estate boom, shows CODs for apartments, commercial and industrial averaging nearly 45 percent. A perfect COD of 0 would mean that every property sold at the market value established by the assessor. That will never happen even if the assessor were perfect, because we all know of properties that were sold for more or less than we thought they were worth. The standards for sales ratio studies set by the International Association of Assessing Officers says CODs should be between 5 and 15 in “larger urban markets.” A COD of 50 means that, on average, a property that should have an assessed value of $1,000,000 would be assessed at $500,000 to $1,500,000. For a more detailed discussion of COD’s see, Tax Facts, “Coefficients of Dispersion Explained,” July/August 2015.
The last 10 years of COD changes are shown on Chart 1 for the three largest classes of property. After volatility associated with the real estate market moved from boom to bust in 2009, the uniformity measures returned to historic levels and have stagnated the last two to three reassessments.
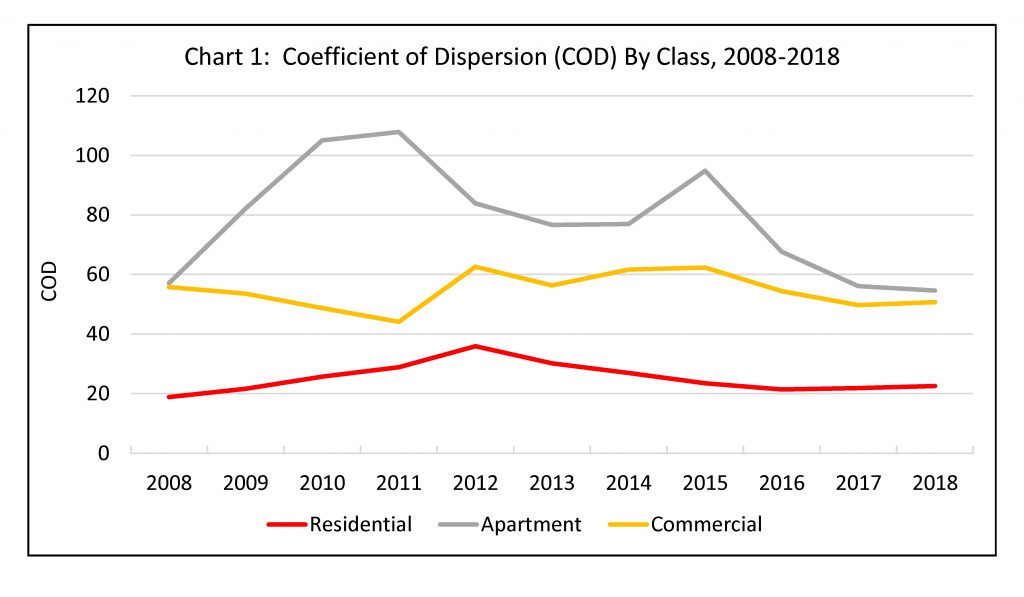
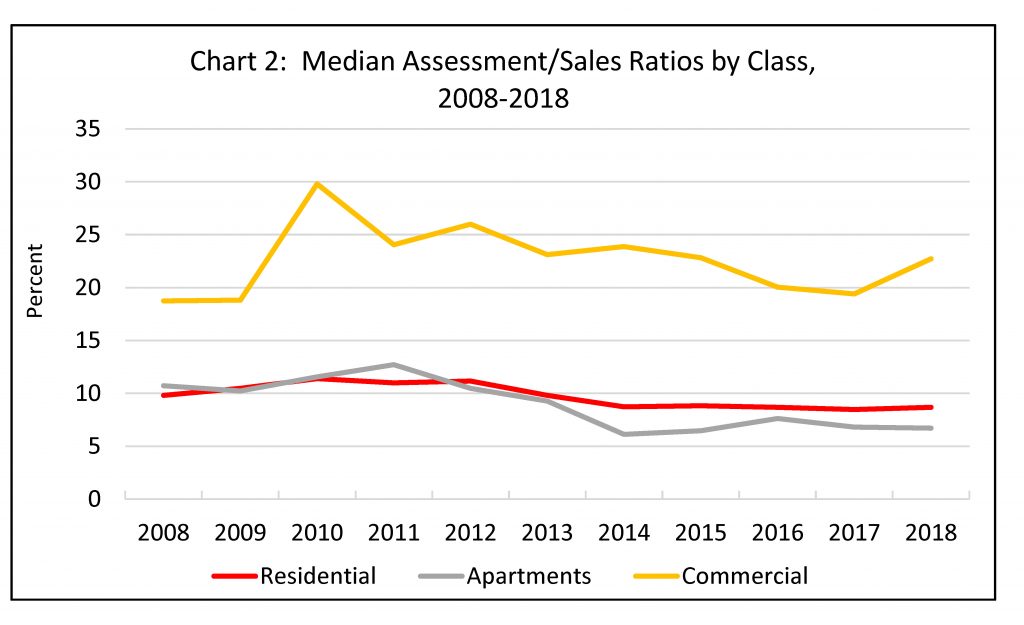
Chart 2 illustrates the last 10 years of changes to median assessment levels. Again, there are ups and downs during the real estate crash. The most consistent level has been for residential assessments. The most significant change has been in Class 3 (apartments) which – abetted by a 2009 Cook County ordinance change that dropped the level of assessment from 16 to 10 – have fallen from a 12.71 percent level to 6.70 percent. See Tax Facts, “A Fresh Look at Illinois Property Taxes,” November, 2017.
IAAO Study
In September Assessor Kaegi released a sales ratio study he commissioned from the International Association of Assessing Officers (IAAO) of the assessments of commercial property: the IAAO study defined “commercial property” for this purpose to include apartments (Class 3), commercial (Class 5A), and industrial (Class 5B) in Cook County in 2018, the last assessment before Kaegi took office. The study compares 2018 market values assigned by the previous Cook County Assessor to 2018 sales prices. The IAAO study found that market values determined by the assessor were 61 percent of the actual market value countywide, lower than any of the class-specific levels calculated by the Department of Revenue in its study of the same year.
Table 4 shows the results of the two studies, by property class. Although both studies are for the same year, there are distinctions between the department’s and IAAO’s studies that may help explain the differences in their results. The IAAO study included many more sales, 1,611 in total, than did the department’s, which included only 555 sales. In Table 4, because of the way the IAAO study is presented, we used a weighted average of the medians presented for the three classes combined into the category of “commercial”.
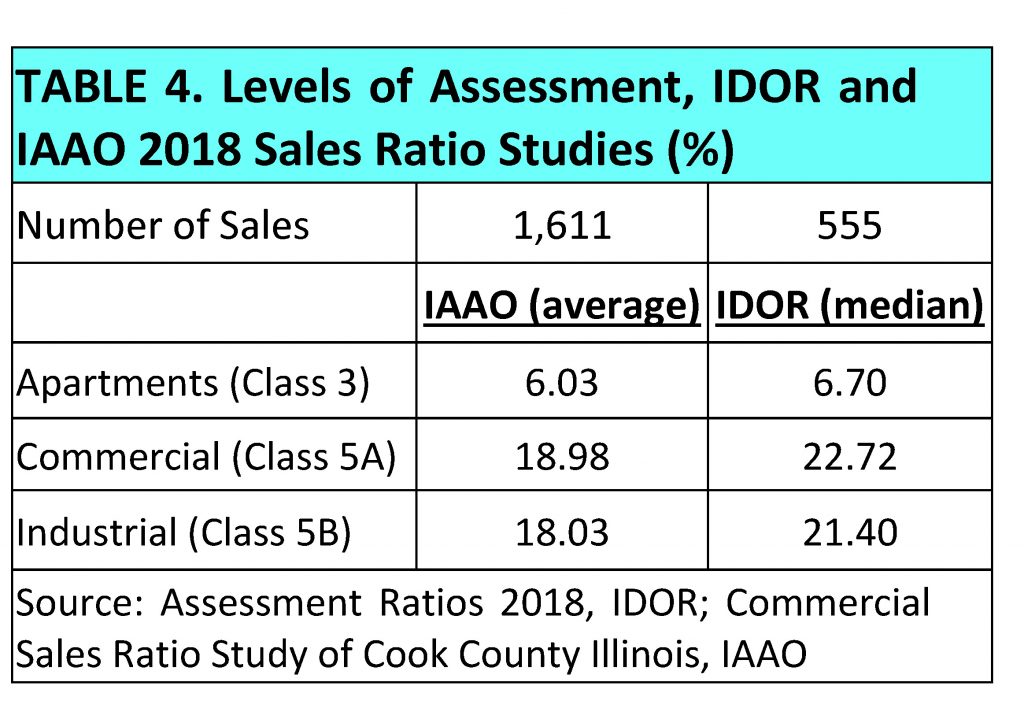
Because the IAAO study breaks sales into minor classes, it provides one striking insight: rental condominiums made up 21 percent of all sales used in the study were the most uniform of any minor class in the study (COD of 6.27 percent) and nearly the most underassessed (median level of assessment of 50 percent).
What the Two Studies Say
Both studies represent the status of assessments when Assessor Kaegi took office – 2018. In Cook County’s cycle, that is the point when countywide assessments are at their highest level, because Chicago has the largest portion of property values and was just reassessed. However, the assessments for the north suburbs were two years old (two years of growth) and those for the south suburbs were one year old (one year of growth). That means all levels of assessment will be below their ordinance levels in a rising market, even if they were properly assessed during their reassessment year.
We asked the assessor’s office about the different results for median levels of assessment in the two studies, as illustrated in Table 4 and they suggested, given the lack of uniformity in assessments (both studies had comparable measures of COD and Price Related Differential), the difference was not significant. We agree.
However, we do believe that the underassessment of apartments, documented in both studies, affects the conclusions of the IAAO study. Apartments represented 45 percent of the ratios used in the study, were the most significantly underassessed of the three Cook County classes combined in the IAAO study, but account for only 12 percent of the EAV in Cook County. Further, as illustrated in Table 2, nearly 80 percent of underassessed apartments are in the Chicago triad, helping explain how the IAAO study’s median level of assessment for commercial properties (at 52 percent) was lowest in the Chicago Triad.
Two other factors are significant: (1) the IDOR methodology of comparing sales to the previous year’s assessment – despite the complications and confusion it adds – avoids selective reappraisal (sales chasing). A study by the Civic Consulting Alliance has identified selective reappraisal as a problem in Cook; and (2) the IDOR methodology starts with data from the Real Estate Transfer Declarations which allow it to exclude personal property included in the sales price, while the IAAO study did not. We believe the personal property exclusion may help explain why the IDOR study had somewhat higher median levels of assessment than did the IAAO study. Even with the uncertainty added by lack of uniformity, the difference in medians was in the direction we would anticipate.
North Triad—2019 Taxes
The first triad to be assessed by Assessor Kaegi was the north suburbs, for 2019 taxes payable in 2020. According to a report by Cushman & Wakefield, a Chicago commercial real estate firm, the assessor boosted commercial and industrial assessments in aggregate by 74 percent and residential by 16 percent in the north triad. The Cook County Board of Review sharply reduced those increases, cutting them by two-thirds. During the reassessment, it was suggested tax rates would drop substantially, but it was not clear how much those higher assessments would reduce rates or what the impact of the Board of Review’s actions would be on rates.
The answer came a year later when the Cook County Clerk calculated tax rates. According to the clerk, total taxes billed in Cook County rose from $14.9 billion to $15.6 billion, a 4.1 percent increase. Our simplistic example showed us that tax bills go up when (1) the amount requested by the local government (the levy) increases or (2) a particular property’s relative share goes up. With regards to relative shares, the clerk reported that the average single-family dwelling’s market value in the north suburbs increased 10.58 percent, while the average business property saw an increase of 22.53 percent. Tax rates dropped just over 9 percent. That left the typical single-family owner paying about 2 percent more, while the typical business property owner saw taxes go up by more than 11 percent. There was a shift in relative share off residential property and onto commercial, industrial, and apartment owners.
The increase in the initial reassessments done for 2019 in the North Triad was greater than what would have been anticipated by the IAAO study, which put the North Triad median at 68 percent. Keep in mind, many would be higher, given the lack of uniformity demonstrated in both studies. The IDOR sales ratio study would indicate an even smaller reassessment increase.
Equalization and the Multiplier
As mentioned earlier, the Board of Review ended up reducing 2019 assessments in the north triad, by $4.4 billion, erasing 2/3 of the increases in assessments. This action provides one last insight to the 2019 results. To calculate the multiplier (used to “equalize” tax assessments across counties) the Department uses its last three sales ratio studies – in this case the 2016, 2017, and 2018 studies, adjusts each for reassessment done in 2019, and computes the three-year average median level of assessment. Given the substantial 2019 assessment increases, before the Board of Review reductions, the countywide level of assessment would have gone up and the multiplier would have fallen from the previous year’s final level of 2.9109 to 2.7523, the tentative Cook County multiplier calculated by IDOR. After the Board of Review rolled back much of the increase, the final multiplier issued by the department rose to 2.9160. In other words, the final level of assessment in the county fell slightly from 2018. The multiplier was applied to each parcel of property in Cook County, including those in the south and city triads, and while it increased EAV it did not change relative shares at all.
It’s worth noting that before the Board of Review reduced assessments, the department’s three-year averages of median assessment levels were 26.60 for commercial and 26.91 for industrial, both slightly above the ordinance level of 25%. It seems unlikely that reassessments in just over a quarter of the county could boost the countywide levels for commercial and industrial property above the ordinance level. The final multiplier calculated after the Board’s reductions set the levels at 23.23 and 22.93 respectively, both slightly below the ordinance level.
Along Came COVID
As property owners in the North Triad were finally seeing the results of the 2019 increased assessments and Board of Review reductions, the economic effects of the COVID-19 pandemic began to be seen. Assessor Kaegi has announced plans to make changes in the 2020 assessments, both in the south triad being reassessed in 2020 and in the other triads as well. By comparing data from the townships where he had already provided initial assessments before announcing the adjustments, and then updated those assessments to reflect a COVID-19 adjustment, it appears that reductions to residential values will exceed those on non-residential properties, prompting further shift in relative shares away from homeowners onto business properties. But, like last year, the actions of the Board of Review are still unknown.
We don’t yet know what impact COVID will have on the market values of properties in the Chicago Triad, scheduled for reassessment in 2021. How empty offices resulting from increased work from home, low hotel occupancy rates, increased online shopping, and the general decline in traffic in downtown Chicago will affect property values in the loop and other business districts has yet to be determined. So too is whether economic changes will impact the desirability of downtown residential condominiums and what that will that mean to their value.
Conclusion
Property taxes are complicated, with many moving parts. Recognizing how those parts are interrelated helps to understand the consequences of proposed changes, which is particularly useful as Cook County’s new Assessor pursues his mandate for (much-needed) reform. Adding to the complexity, of course, is the fact that property values in Cook County are in flux as a result of the economic repercussions of COVID 19.
We can glean a number of useful insights from the two 2018 sales ratio studies described above.
In terms of assessment uniformity, the assessor is correct to focus on long-standing problems.
- High Coefficients of Dispersion – the statistical measure of average assessment error – demonstrate the need for reform in the assessment process. This lack of uniformity—evidenced by high CODs—is long-standing.
- For all classes of property, given the lack of uniformity of assessments – reform will mean increases for many property owners and reductions for others.
- The assessor has emphasized uniformity of assessments in his explanation of reassessments to date in the North and South triads.
- The Department of Revenue’s backward-looking sales ratio study will not provide an outside view of uniformity until 2020 sales ratio study compiled in 2022, and then just for the 2019 reassessment of the North Triad.
In terms of relative share the picture is far less clear:
- In Cook County apartment properties have been significantly underassessed since 2014.
- Assessor Kaegi’s first reassessment effort, in the North Triad in 2019, boosted non-Class 2 assessments significantly, which would in turn have increased the relative share of business properties, but those increases were significantly, but not completely, rolled back by the Board of Review.
- The North Triad proposed increases exceeded the underassessment indicated by the IAAO study.
- According to the Department of Revenue’s sales ratio study, all classes of property, except apartments, are underassessed by roughly the same percentage, (See Table 3) meaning reform should not bring a big shift in relative shares between business and residential classes.
Final thought
Given the lack of uniformity in Cook County assessments, “reform” will mean higher property taxes for many property owners. The increase will fall particularly heavily on owners of apartments. There will be lots of complaints. However, given the available data, reform should not mean an overall relative shift off residential owners onto business property owners.
*Mike Klemens is the Founder of KDM Consulting Inc., and does tax policy research for the Taxpayers’ Federation of Illinois.