
Comparing Governor Pritzker’s Proposed Graduated Income Tax to Other States
Comparing Governor Pritzker’s Proposed Graduated Income Tax to Other States
April/May 2019 (72.4)
Introduction
The Illinois income tax has been imposed at a flat rate since its inception in 1969. The debate over converting to a system that imposes higher tax rates on high-income residents has been the biggest story of the 2019 legislative session, with the usual suspects raising the usual policy and political points. In this article, we focus on where Illinois would stand compared to selected states, using the rates and brackets originally outlined by Governor Pritzker. For our previous research on this topic see: “Graduated Income Tax Viewed from a Policy Perspective,” Tax Facts, April/May 2014, and “Tax Policy, Tax Politics and a Graduated Income Tax,” Tax Facts, September/October, 2016.
Historical Context
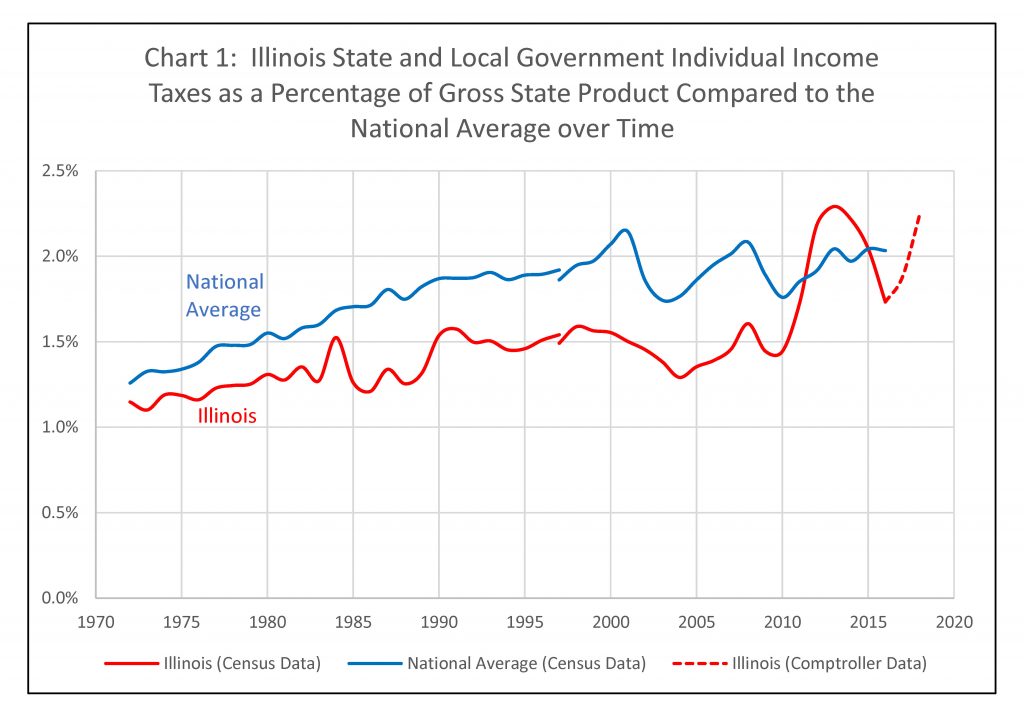
Before we look at how Illinois compares to selected states and the impact on specific taxpayers, it is worth taking a look at Illinois’ personal income taxes overall, and over time. Chart 1, from a pending TFI Publication entitled Tax Facts: An Illinois Chartbook, compares Illinois personal income tax collections as a percent of Gross State Product to the national average over its almost 50 year history. The chart shows that Illinois had traditionally been below the national average, until the rate increase in 2011. After the rate rolled back in 2015 Illinois returned to below the national average but jumped above again when the increases were (mostly) restored in 2017. If you look closely you can also see the impact of the 18-month temporary increase in 1985 and of the 1989 temporary increase that eventually became permanent.
A Comparison to Other States
Most state-to-state comparisons of Governor Pritzker’s proposed income tax rates have been limited to marginal rates in other states. However, tax rates alone usually don’t paint a complete picture, because of things like exemptions, deductions, credits, and income taxed at lower rates. And looking at state-wide averages, such as income taxes per capita, also can be misleading because the tax distribution across income levels can vary significantly.
When Governor Pritzker unveiled his proposed income rates on March 7, he used six sample families of varying incomes to show how they fare under Illinois’ current tax structure and how they would fare under the proposed rates:
1. Single parent that rents with two children earning $17,160
2. Married couple with two children that earns $61,000 and pays $3,500 in property taxes
3. Married couple with one child that earns $125,000 and pays $5,000 in property taxes
4. Married couple with no children that earns $250,000 and pays $8,000 in property taxes
5. Married couple with two children that earns $500,000 and pays $16,000 in property taxes
6. Married couple with one child that earns $5,000,000 and pays $25,000 in property taxes
We thought it would be informative to see what those families would pay under other state’s income tax systems. To do this, we computed the 2018 income taxes each family would have paid in five midwestern states and three states with large populations and diverse economies, like Illinois. It is important to note that not all states have individual income taxes, including Florida and Texas, also states with large populations and diverse economies. All six sample families would pay $0 in income taxes in those states.
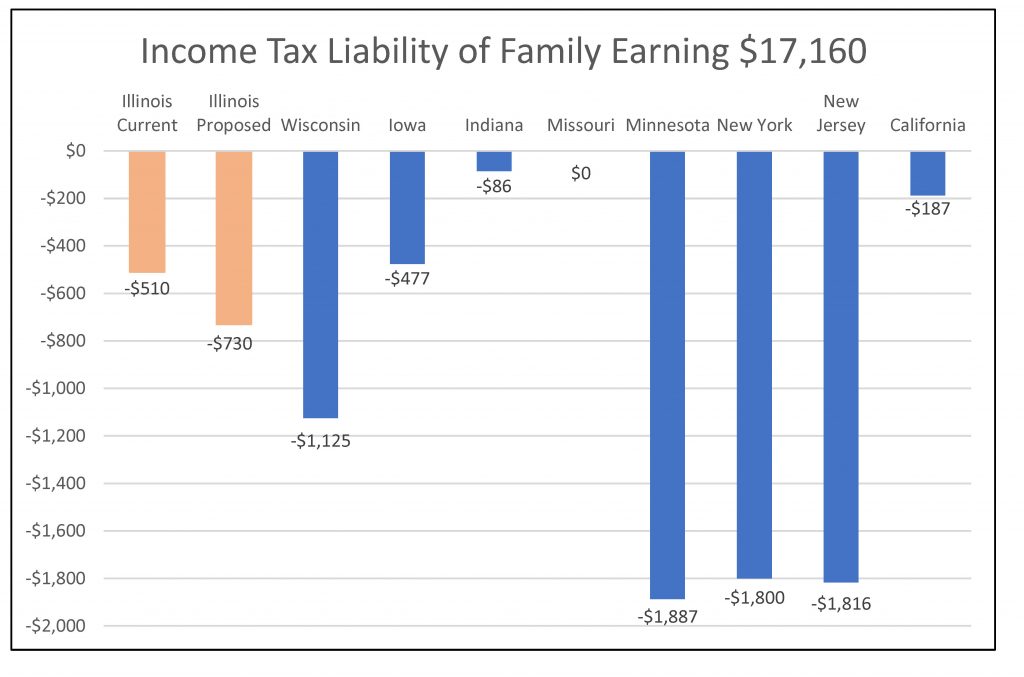
Family One would not pay tax in any of the selected states. Many states, like the federal government, have an earned income tax credit or similar benefit program assisting the working poor that results in a negative tax liability—a cash payment from the government. This is the case in all of the sample states except Missouri. The refund Family 1 receives is larger in four states than the refund in Illinois. Somewhat surprisingly, California which is generally considered a more liberal state, would issue a smaller refund.
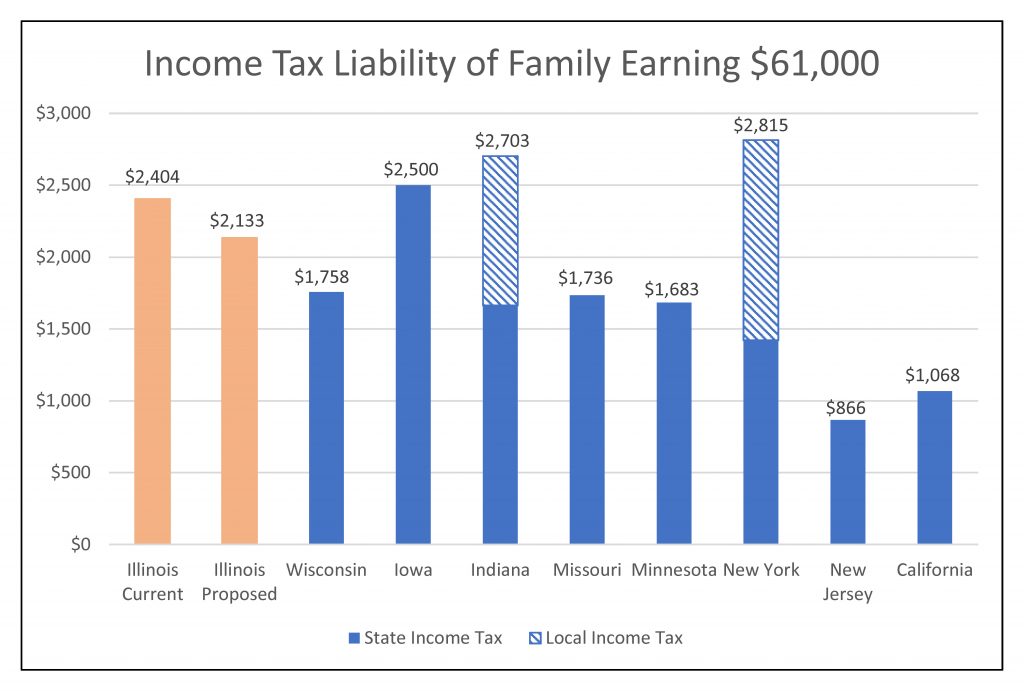
Family Two’s Illinois income tax bill is fourth highest among the selected states. Under Governor Pritzker’s proposal, their liability would decrease by 11%, or $271. While they would see relief under the Governor’s proposal, the rankings wouldn’t change. The family would have a higher income tax liability in Iowa and Indiana. Their income tax liability in New Jersey (frequently considered a high-tax state) is dramatically less than their current liability in Illinois, by 64%.
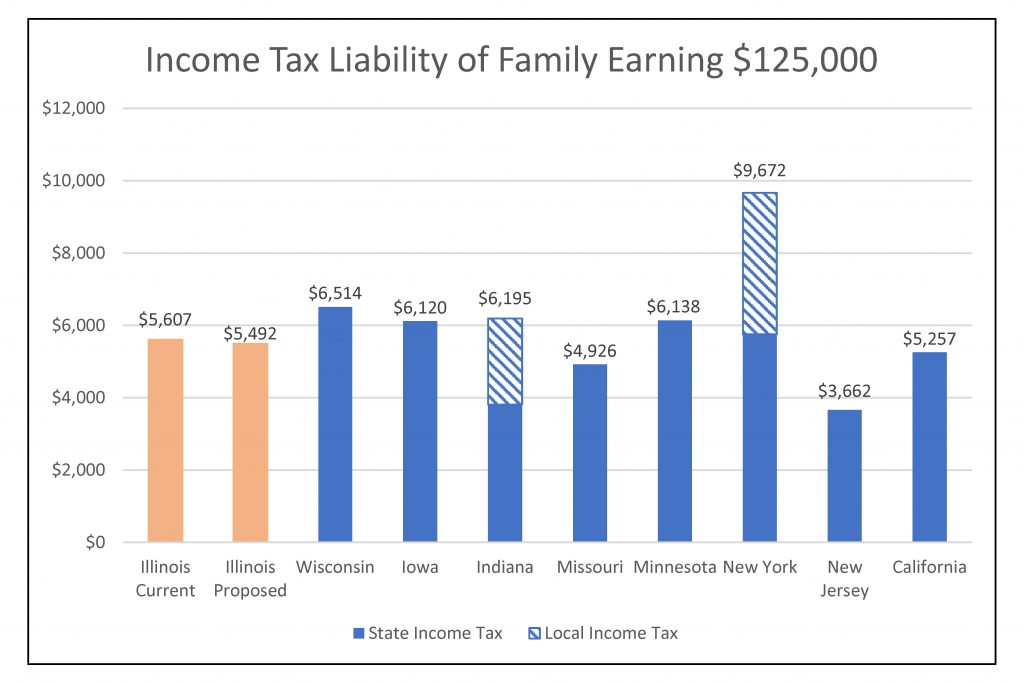
The Governor’s proposal reduces Family Three’s Illinois income tax liability by 2%, or $115. The reduction does not change Illinois’ standing among the selected states.
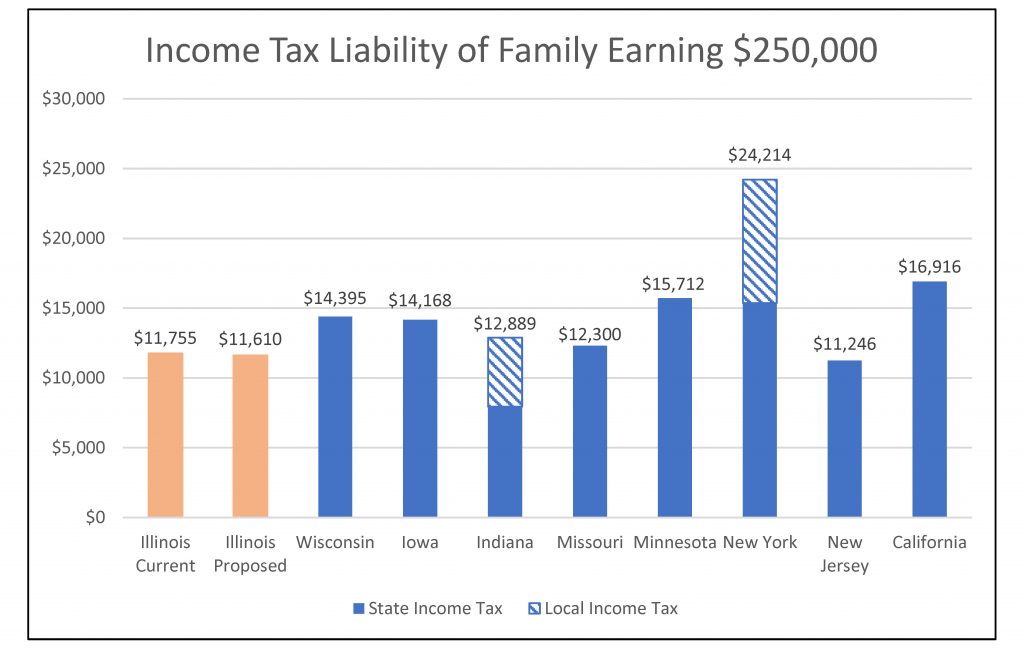
Under the Governor’s proposal, income over $250,000 would be taxed at a higher level than it is now. Family Four makes exactly $250,000, however, and would see a decrease of $145 or 1.2%. Somewhat surprisingly, this family currently pays (and would continue to pay) lower income taxes in Illinois than in all but one of the selected states. Family 4 currently pays $2,640 more in Wisconsin than in Illinois. Another surprise: as with Families Two and Three, New Jersey imposes the lowest income tax of the selected states on Family Four.
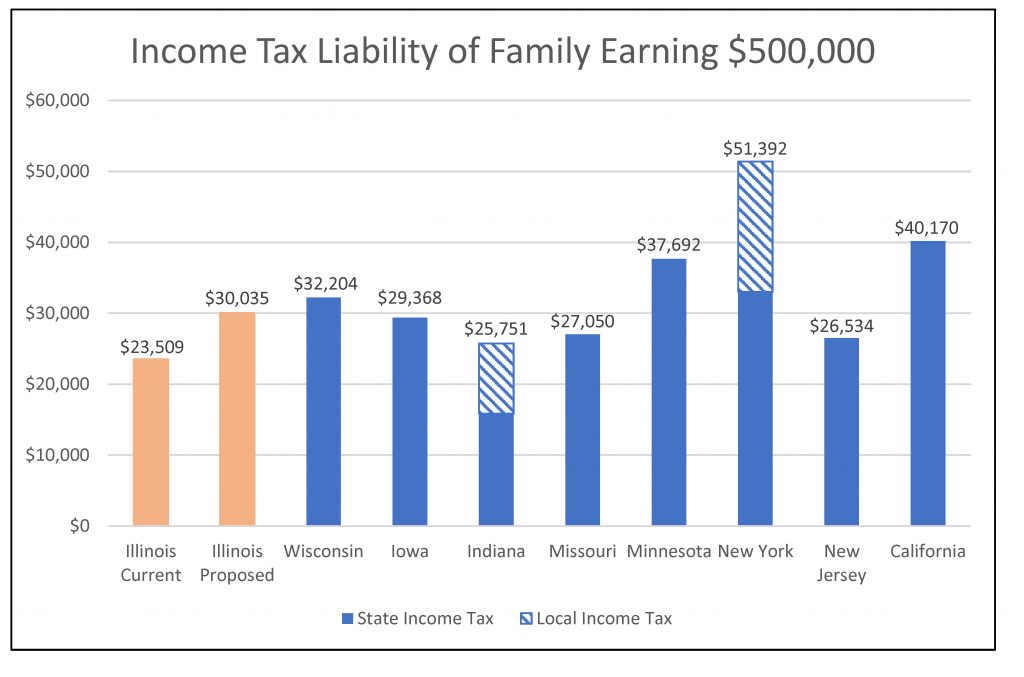
Family Five is the first sample scenario that would see their income tax increase, from $23,509 to $30,035, or 28% under Governor Pritzker’s proposal. Currently, this family pays less in income taxes in Illinois than they would in any of the selected states. After the increase, Family Five would pay more in four states and less in four, putting Illinois right in the middle.
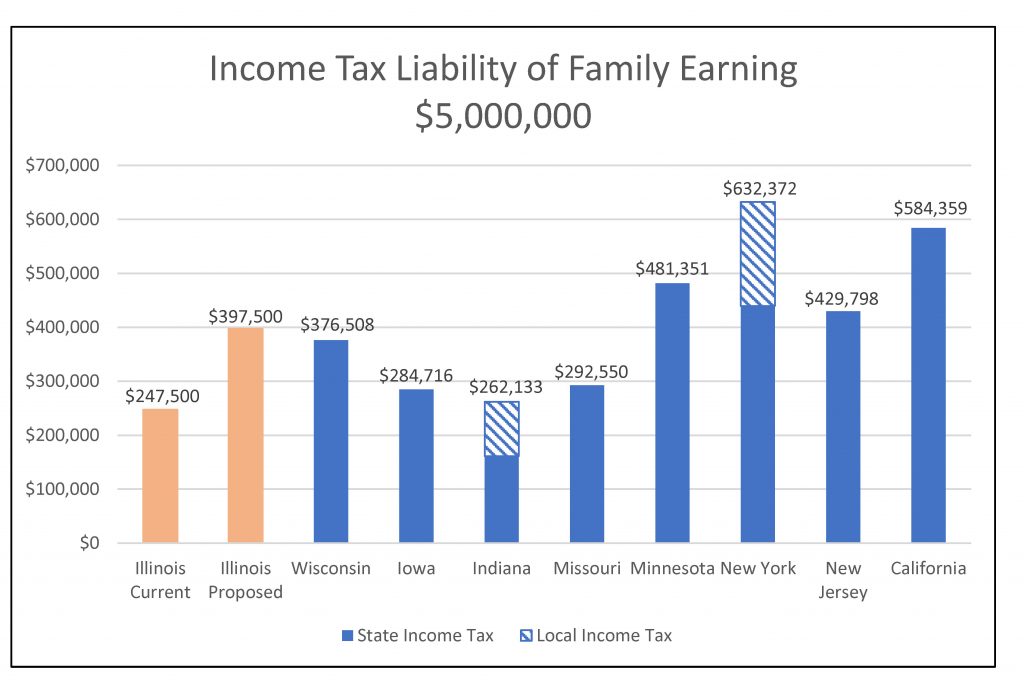
Under Governor Pritzker’s proposal, Family Six would see their income tax liability increase by 61%, or $150,000. Like Family Five, their current tax liability is lower in Illinois than all of the other selected states. If the Governor’s proposal is enacted, they would have lower liabilities in four states and higher liabilities in the other four states, putting Illinois in the middle.
What does this all mean for lower-income taxpayers? How Illinois compares to other states has always differed, based on the taxpayers’ income level. Illinois’ Earned Income Tax Credit puts us in the middle of the selected states. Once that is phased out, for middle income taxpayers, we have an above average income tax. Then as incomes grow, we slowly become below average. Under Governor Pritzker’s proposal, the higher rates for income above $250,000 puts Illinois more in the middle of the pack.
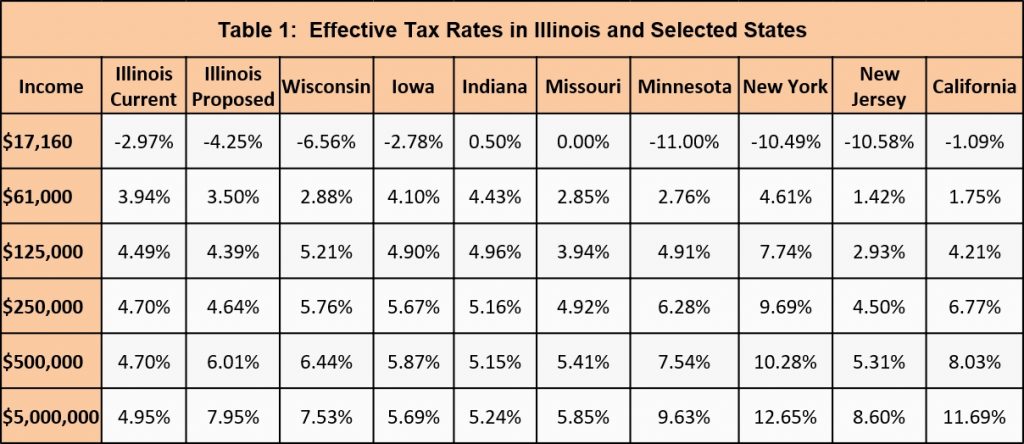
Effective rate vs. marginal rate – A “marginal” tax rate is the rate applied to the last dollar of income a taxpayer earns. When a state has a flat rate structure, as Illinois does now, the top marginal rate is the same for every taxpayer. Traditionally, in a graduated rate structure, the only income subject to the higher tax rates is the income in that particular bracket; the taxpayer’s first dollar of income is still subject to the lower rate applicable to all taxpayers in that bracket. Focusing solely on the marginal rate, then, makes no sense: a taxpayer earning $250,001 would be in the “over $250,000” bracket, but only $1 of income would be subject to that tax rate. This is why we have calculated actual tax liability, and from there have calculated “effective rate,” which compares taxable income to taxes actually paid—sort of a blended or weighted average rate. The effective rates for the six sample families in the comparison states, and Illinois before and after the proposed new structure, are set forth in Table 1.
A word about methodology – Indiana, Iowa, and New York all have local income taxes. In our calculations, we assumed the family lived in the most populous part of the state and would be subject to those local income taxes. In Iowa, while 85% of school districts have an income surcharge tax, Des Moines does not. In Indiana, counties are able to impose a county level income tax. Indianapolis is in Marion County which imposes a 2.2% income tax. Finally, New York City imposes a graduated income tax on its citizens with a top rate of 3.876%.
Conclusion
When comparing the impact of a state tax proposal to other states, it is imperative to look at the bottom line, and not merely the sound bites. Actual tax liability, as calculated in this report, is the relevant comparison point, particularly to the impacted taxpayer, and not, for example, the marginal rate that applies to the last dollar earned.
Not surprisingly, the relatively small tax relief proposed for families earning $250,000 or less does not change Illinois’ ranking among the selected states for those families. This is clear from both the family-by-family charts and the effective rate table.
However, for the two highest-earning sample families, the proposed Illinois change would mean significant tax increases, and those increases would move Illinois from the bottom to the middle of the rankings among the selected states.
It is also worth noting the impact of local income taxes: those taxes make dramatic differences in both the tax liability of the sample families and the state rankings in Indiana and New York. Failing to include that data in comparisons can lead to inaccurate and misleading results.
Taxes are complicated, and evaluations of tax proposals must reflect those complications.