
An Illinois Sales Tax Conundrum: High Rates and Low Receipts – Dr. Natalie Davila
An Illinois Sales Tax Conundrum: High Rates and Low Receipts
March 2020 (73.3)
by Dr. Natalie Davila*
Illinois’ economic activity and its personal income, on a per capita basis, exceed national averages. One would expect that consumption, as reflected in sales tax collections per capita, would also exceed the national average. However, that is not the case. Our recent publication “Tax Facts: An Illinois Chartbook” indicated state and local sales tax revenue as a percentage of Gross State Product (GSP) is low in Illinois, according to data from the U.S. Census Bureau’s Survey of State and Local Government Finances, where Illinois stood 17th lowest out of 50 states. Why is that? In this report we try to explain the reasons behind Illinois’ low sales tax collections by using publicly available data and looking in detail at a neighboring state—Iowa – and examining several oft-suggested hypotheses.
Illinois’ Sales Tax Collections Don’t Match Our High Tax Rates
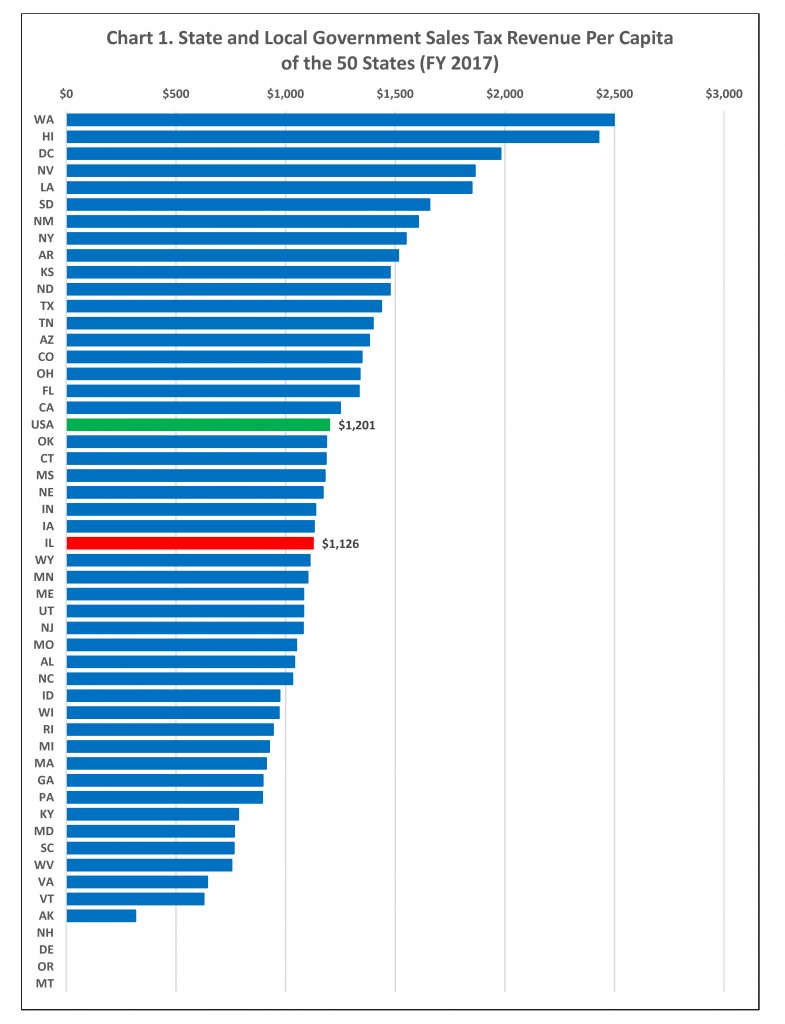
Looking first at state and local sales tax together, Chart 1 illustrates that Illinois collects $1,126 per capita compared with a national average of $1,201. Illinois collections were below the national average despite the fact that its population-weighted average state and local sales tax rate of 8.64 percent was higher than the national average of 6.49 percent, according to the Tax Foundation’s publication, “State and Local Sales Tax Rates in 2017.”
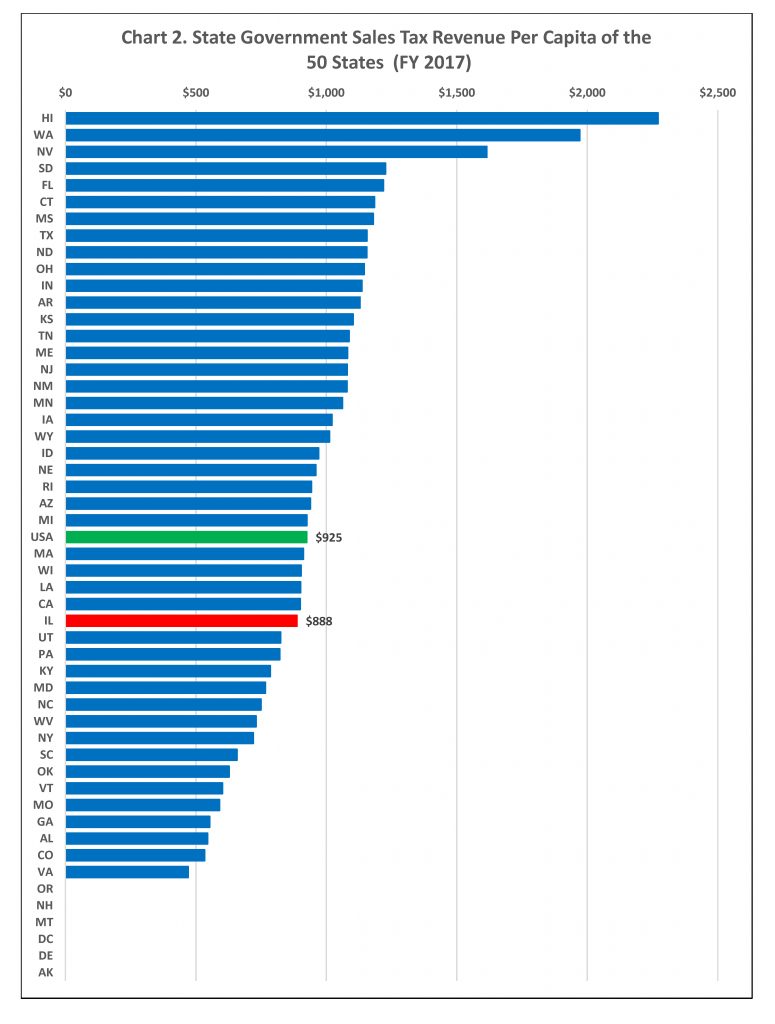
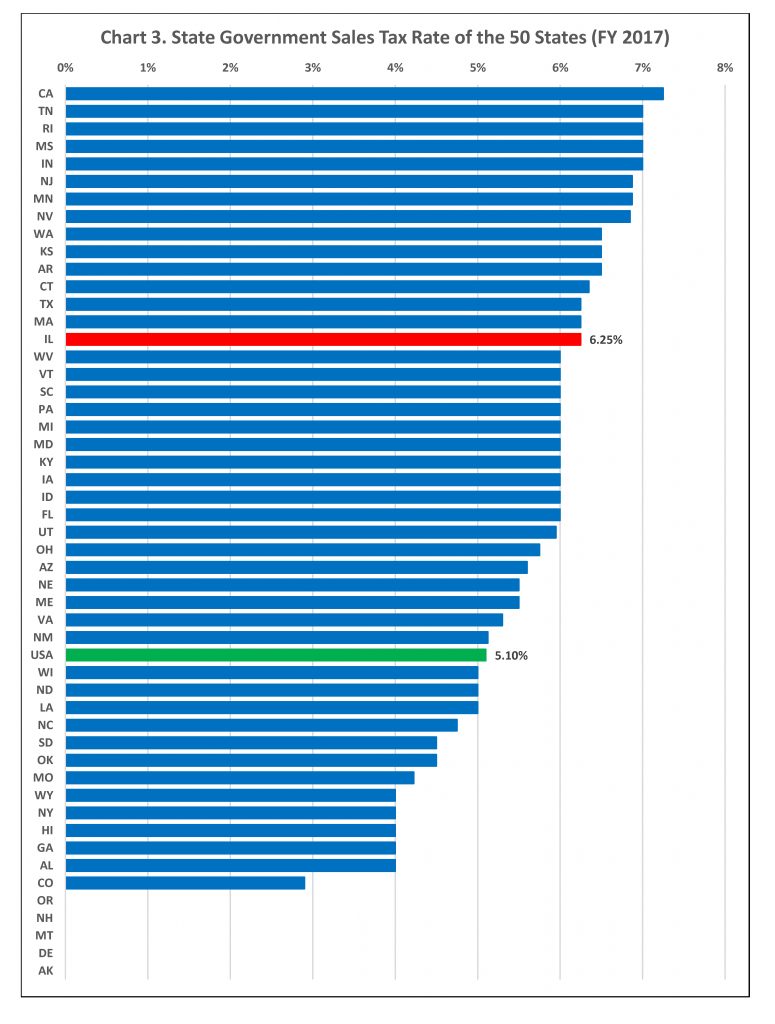
Looking only at state sales tax we find the same disparity. Illinois state sales tax collections per capita were $888 compared to a national average of $925 (Chart 2). Illinois collections were below the national average despite the fact that its state sales tax rate of 6.25 percent was higher than the national average of 5.1 percent, as shown in Chart 3.
Why?
What explains Illinois’ low state sales tax collections? Many hypotheses have been suggested, but most have not been examined in any great detail. This research attempts to determine, where possible, how much each of the following factors contributes to Illinois’ lower than average sales tax per capita:
- Rate and base differences, generally
- Taxation of services
- Tax exemptions
- On-line tax collections
In this article we will test these various hypotheses by comparing detailed data from Illinois and Iowa. We select Iowa because not only is it frequently used as a model for how Illinois might consider taxing services, but also it is the Midwest state that ranks closest to Illinois in term of sales tax per capita.1
If we can identify the reasons Illinois’ tax collections lag other states, we will know whether those differences are attributable to sound tax policy decisions, and could offer policy makers options to raise the below-average revenue, reduce the above-average rates, or both.
Comparing Apples-to-Apples
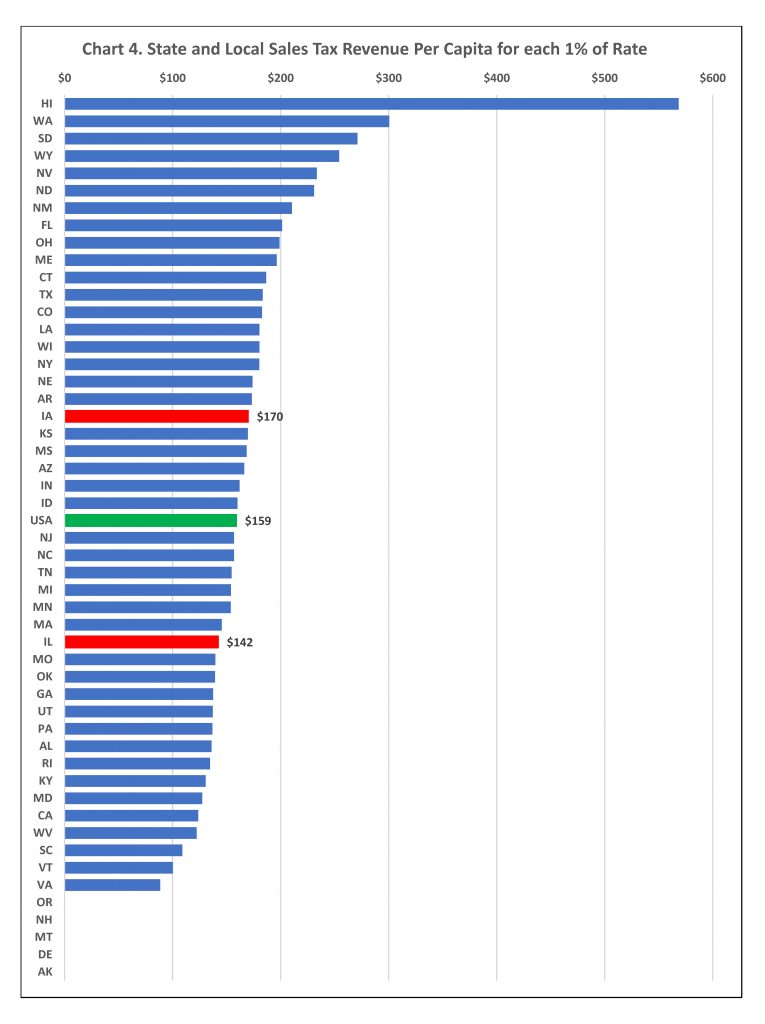
To try and get to the bottom of this high rate/low revenue phenomenon in Illinois we first need to calculate a measurement that controls for differences in population and sales tax rates across the states. This will allow for a more apples-to-apples comparison between and among states. We make this adjustment by dividing total state sales tax collections from the census bureau by population to get a per capita figure. We then divide that figure by the state sales tax rate to arrive at a unit of comparison that shows how much state sales tax is generated per person for each 1 percent in sales tax rate. We can then compare this figure that we will call “Per capita tax – 1%” among states. We apply this same approach as we evaluate the various hypotheses explaining why Illinois has high tax rates but low receipts.
The basic calculation for Illinois and Iowa, our comparison state, is highlighted in Chart 4. Illinois, even though its combined state and local rates are significantly above average, displays middle-of-the-pack and below average sales tax receipts per capita.
To simplify our analysis, we will focus only on state sales tax collections. We do this because local sales taxes are not applied uniformly within or among states. Only 38 states allow a local sales tax. In addition, even in those states that allow local sales taxes not all taxing jurisdictions actually impose a local sales tax and those that do can do so at different tax rates. For example, in 2017 the local sales tax rate in Illinois ranged from 0 percent to 4 percent.
Income and GSP per capita is higher in Illinois than in Iowa. Everything else being equal this would presumably mean Illinois’ per capita sales tax revenue would be higher than that in Iowa. However, when we account for differing sales tax rates and populations, we find that in 2017 Iowa sales tax revenue per capita for each 1% in tax rate is $28 higher in Iowa than in Illinois. This translates into a whopping $2.4 billion less in tax at the 6.25 percent rate.
1. Rate and Base Differences, Generally
Our first step in examining the disparity in tax collections between Illinois and Iowa is to make some adjustments for several differences between the way the states tax major categories of goods, either through exemptions or lowered rates.
Food, drugs, and autos
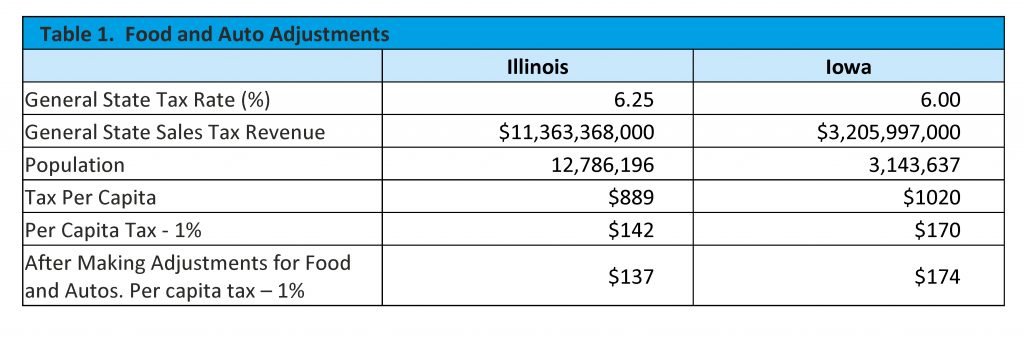
Two major categories of otherwise taxable goods are subject to different rates of tax in our two comparison states: food and drugs, and automobiles. We need to make adjustments in our calculations to reflect these differences. Illinois taxes food and drugs at a 1 percent rate, money that is all returned to local governments but is nevertheless part of the state 6.25 percent sales tax, whereas Iowa totally exempts food and drugs. To make the states comparable, we must take out revenue associated with Illinois’ 1 percent tax on food and drugs. Meanwhile, in Iowa autos are taxed at 5 percent rather than the general sales tax rate of 6 percent, so we calculate the value of a 1 percent tax on autos and add it to the Iowa base. These adjustments intended to align the states do not eliminate the disparity and in fact widen rather than narrow the gap between the two: one percentage point per capita of $137 in Illinois compared to $174 in Iowa, as shown in Table 1.
Utilities
As we indicated in the Illinois Chartbook, some states include utilities in their general sales tax base – Iowa is one such state. Others, like Illinois, tax utilities under a separate utility tax. So, we need to subtract communications, electric and gas, and water and sanitation from the Iowa sales tax base. These revenue sources totaled $320.3 million for Iowa in 2017.
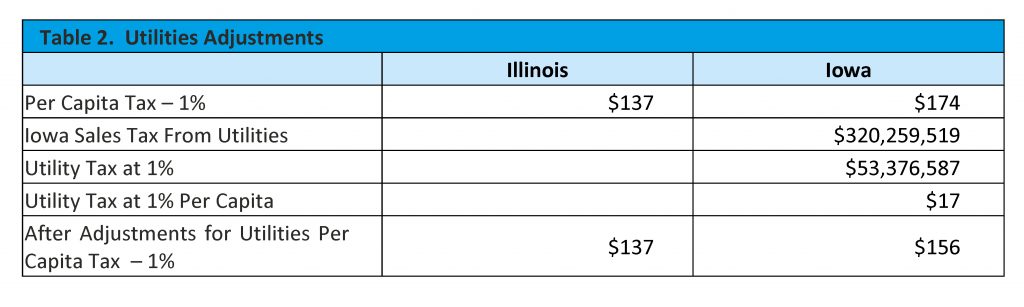
When we take utilities out of the Iowa base the per capita – 1% disparity between the two states is reduced from $37 to $19. This goes a long way towards explaining the disparity between the states (and readers should be mindful that Illinois collects taxes from utilities through separate excise taxes, so this is not foregone revenue). The tax impact of the remaining difference, however is still $1.4 billion—definitely worth further exploration
Gasoline
There is one additional significant base difference: Illinois includes gasoline in the sales tax base while Iowa does not.
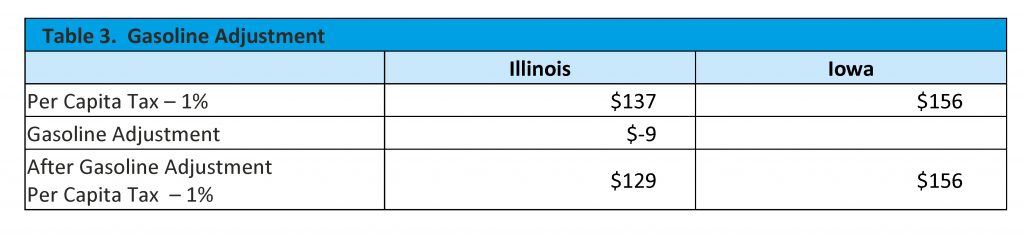
Making a base adjustment to account for Illinois’ gasoline sales increases the disparity, accounting for rounding, from $19 to $27 per capita for each 1% in tax rate.
2. Taxation of Services
Iowa subjects a number of services to sales tax, while Illinois generally excludes services from taxation. Some of the services taxed in Iowa that generate the largest revenue, according to a breakdown from the Iowa Department of Revenue, include:
- Business services ($83 million). Some examples published by Iowa are: bank and financial institution service charges; electrical and electronic repair and installation; and non-residential janitorial and building maintenance or cleaning2
- Auto Repair ($68 million)
- Beauty/Barber shops ($25 million)
Iowa’s sales tax revenue in 2017 for services (excluding hotels and amusement) totaled $313.2 million. In the table below we adjust these figures for respective population and tax rate differences. We also discount by 50 percent Iowa’s revenue for certain repair services that are covered under Illinois’ SOT (such as auto repair). Using this adjusted Iowa data generates an estimate of $1.0 billion in revenue if these services were taxed in Illinois. A recent study by CGFA estimated that Illinois would generate approximately $1.2 billion at the 6.25 percent rate if the same services taxed in Iowa were taxed in Illinois. Given the huge uncertainty in making such estimates we conclude that our estimate is comparable to the CGFA estimate in terms of degree of magnitude.
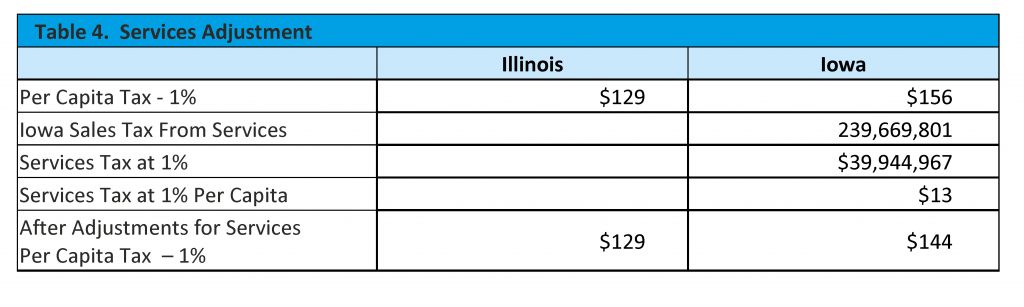
This adjustment accounts for $13 of the difference in the higher sales tax per capita for one percentage point collected in Iowa than in Illinois, narrowing that difference to $15. Once again, we have partially—but not completely—explained the discrepancy.
3. Sales Tax Exemptions
The next hypothesis we wish to examine is – are Illinois’ tax expenditures higher than those in Iowa? At first blush, comparing tax expenditure reports from the two states does not corroborate this: reported tax expenditures in Iowa are some $9.8 billion while in Illinois they total $4.1 billion, according to the states’ respective Tax Expenditure Reports. However, this comparison is flawed as the Iowa tax expenditure report is much more comprehensive than Illinois’. Iowa’s report also includes tax expenditures associated with services that Iowa has exempted from taxation, whereas Illinois does not tax services and as a result, naturally does not include comparable expenditures in their report. For example, Iowa’s tax expenditure report includes the following tax expenditure that Illinois does not:
- Purchases for resale are exempt from tax in both states. In Iowa, this is considered a tax expenditure and is estimated at $3.1 billion. However, Illinois does not consider this a tax expenditure for reporting purposes.
- Retail sales made outside of a state are not taxed. Iowa treats this exemption (required by the US Constitution) as a tax expenditure for reporting purposes, valued at $431.4 million, while Illinois does not.
- Medical services are exempt from Iowa’s tax. Since Illinois does not tax services they are not taxed and therefore not considered a tax expenditure. In Iowa the tax expenditure is estimated at $570.5 million.
- Similarly, construction services are exempt from tax in Iowa. This exemption is estimated at $465.8 million, but once again because Illinois does not tax services in the first place, there is no comparable tax expenditure in its report.
While we have received feedback from reviewers that a walkdown to get to a 1 percent per capita tax expenditure figure, similar to our 1% per capita tax collections figure, should be included in this article, given that the individual state definitions of what is considered a tax expenditure for reporting purposes is so different, such a comparison would not help explain the remaining disparity.
We therefore decided to examine a few specific tax expenditures more closely, particularly those that focus on business-to-business inputs because some claim that Illinois exempts more such inputs from the sales tax base.3 In an annual study of the amount of business share of taxes paid, the “Total State and Local Business Taxes” report published by the Council on State Taxation and Ernst & Young (COST/EY) finds that 37 percent of Illinois sales tax is paid by businesses, while 47 percent of Iowa sales tax is paid by businesses.
When we examine the tax expenditure reports for the two states, we find that exemptions for tangible personal property used as a business input in manufacturing to be generally comparable.4 The situation with regards to services is obviously not the same since Illinois does not tax services. COST/EY discusses how most states who tax services do not exempt most business-to-business transactions. When we examine Iowa’s tax expenditure report, we find this to be the case in Iowa. While there are a few exempt services related to manufacturing most of Iowa’s taxable services do not have a business-to-business exemption.5 We reached out to the COST/EY study’s authors to try to get more information on their methodology but had not heard from them at the time of writing.
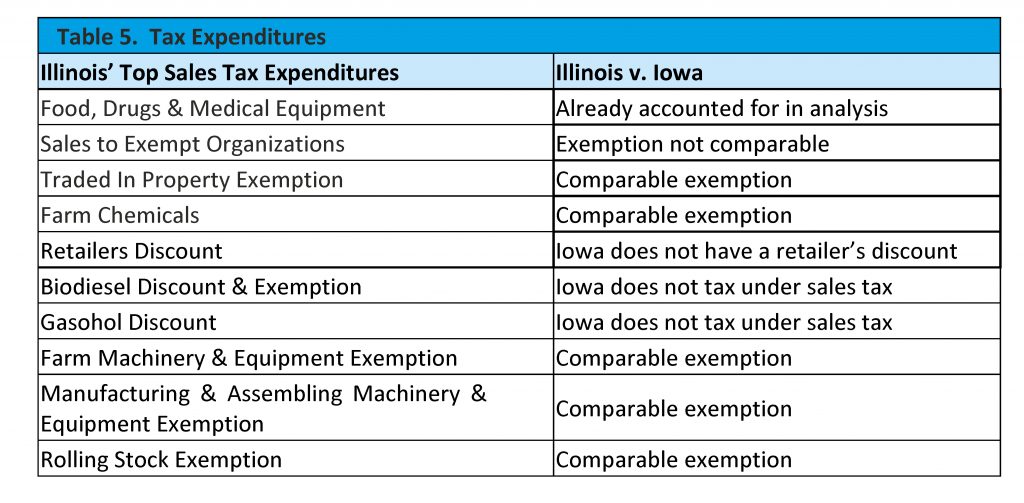
One last approach to examining the differences in tax expenditures was to take Illinois’ top tax expenditures and see how such sales would be treated in Iowa. One of the major differences we found was that Illinois was more generous in its exemption for sales to non-profits, although Iowa does have a broad exemption of construction materials for non-profits, and is more generous in its exemption for sales by non-profits. Overall the two states differ too much in treatment of exempt organizations to be able to calculate a difference. Our findings are summarized in Table 5.
Calculating a per capita sales tax per percentage point for the comparable exemptions identified above but not previously taken into account in our calculations yields $11.30 for Illinois and $20.50 for Iowa. In other words, Iowa is missing out on $20.50 per person per 1% in tax as a result of these exemptions, while Illinois’ tax collections are reduced by only $11.30 per person per 1% in tax. Illinois’ per capita percentage point revenue foregone would need to be bigger than Iowa’s if tax expenditures explained the states’ tax collection disparity. This analysis tends to support the hypothesis that exemptions do not explain the disparity.
4. Online use tax collections
Frequently, the term “sales tax” is used to mean both a state’s sales tax and its use tax. Broadly speaking, sales tax (in Illinois, “sales tax” is the colloquial term for our Retailers’ Occupation Tax) is due if the transaction occurs within the state; use tax is due if the transaction originates out-of-state but the taxable goods (or services) are shipped into or otherwise used/consumed in the state. Out of state sellers are frequently required to collect use tax, and if they do not do so, the customer is required to calculate and remit the tax itself. Is it possible that use tax collections are higher in Iowa, and that in Illinois compliance with use tax collection obligations is less, adding to the discrepancy in taxes collected per capita per 1% in tax rate?
The tax numbers used so far in this analysis include state level sales and use taxes combined. If use tax collections in Iowa per capita per 1 percentage point in tax rate were higher than the comparable figure for Illinois, it could help explain the disparity between the states.
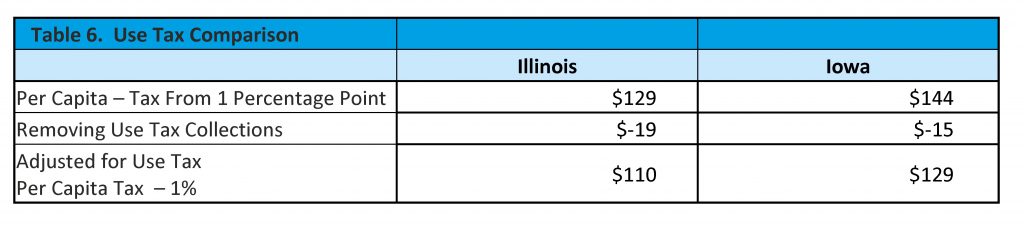
In 2017 Illinois collected $1.5 billion in use tax. This translates into $19 per capita for one percentage point in the tax rate. Iowa collected $291 million (excluding utilities and services) or $15 per capita for each 1 percent tax. Therefore, we cannot accept the hypothesis that Illinois has lower than average per capita use tax collections – 1% when compared to Iowa.
Conclusion
It is often claimed that Illinois has a narrow sales tax base. An analysis of raw Annual Survey of State and Local Finance data shows that in 2017 Illinois generated $142 for every percentage point of state sales tax per capita compared with $170 in Iowa, providing support for that claim.
Looking more closely:
- Rate and base adjustments to make an apples-to-apples comparison reduce the per capita per percentage point disparity from $28 to $27.
- If we then adjust for Iowa’s taxation of services, the disparity is reduced to $15 per capita for each sales tax percentage point.
- The disparity leads us to test the hypothesis that Illinois exempts more transactions from its sales tax. However, we find no evidence to suggest that Illinois’ tax expenditures are higher than those in Iowa.
- Illinois has a higher use tax collection rate than Iowa. Therefore, a failure by sellers to collect tax from on-line transactions does not account for the fact that Illinois collects less in tax than Iowa on a per capita basis per 1% in tax.
Once all adjustments we have been able to identify and quantify are made to align the bases in the two states, the disparity between the two is reduced from $28 per capita for each percentage point in tax to $15 per capita for each percentage point. This translates in a reduction in Illinois “revenue loss” from $2,398.3 million to $1,200.2 million.
We invite our readers to contact us with possible explanations for which we have not tested to help further our understanding of this difference. There are clearly other significant factors that in part explain Illinois’ relatively low sales tax collections per percentage point per capita.
ENDNOTES
1 https://www.census.gov/programs-surveys/gov-finances.html
2 For more information see https://tax.iowa.gov/iowa-sales-and-use-tax-taxable-services.
3 https://www.cost.org/globalassets/cost/state-tax-resources-pdf-pages/cost-studies-articles-reports/1903-3073001_cost-ey-sales-tax-on-business-inputs-study_final-5-16.pdf
4 On the other hand, Iowa has broader tax expenditures for the agricultural sector than Illinois, while Illinois levies sales tax on coal and steam used in energy production.
5 Services used by a processor are exempt only if they alter a raw material.
*Natalie Davila is President of KDM Consulting. An economist with an extensive background in public finance, she was Director of Research for the Illinois Department of Revenue for 10 years.