
An Illinois Chartbook – How Does Illinois Compare?
An Illinois Chartbook
How Does Illinois Compare?
August 2023 (76.5)
People frequently ask how taxes in Illinois compare to those in other states. The story of six blind men and the elephant comes to mind. In the story, each man touched a different part of the elephant: the side, the trunk, a tusk, a leg, an ear, and the tail. Each of the men had very different experiences based on the part they touched. An accurate picture of the elephant was possible only if the men put their experiences together. Similarly, no single chart or figure completely encompasses taxes in Illinois.
In this article, and throughout the series of articles we are publishing this year comparing Illinois taxes to other states, we will provide a variety of views in order to portray a more complete picture. A few notes on the data we use, before we begin:
- To provide an accurate picture we look at state and local taxes combined. Some states pay for services with state funds, while others leave that funding to local governments and local taxes. Furthermore, a person buying $100 worth of groceries and other household goods usually does not know (or care) who imposed the sales tax on those goods, and which government receives the tax.
- Secondly, tax collection rankings should reflect the states’ differing economies (which often reflect different costs of living and income levels). For example, let’s assume States A and B both have a flat income tax rate of 5%, but in State A the median personal income is $50,000, and in State B the median personal income is $55,000. As a result, the median State A resident would pay $2,500 in income taxes and the median State B resident would pay $2,750. Even though the two states have the same rate, the State B resident pays more in absolute dollars, but she also has more after-tax income. Does State B have higher taxes, or are they equal? We would posit that they are equal, but under a per capita comparison, B’s taxes are higher. To avoid this distortion, we look at taxes as a percentage of gross state product (the total value of all goods and services produced within the State) to arrive at the percentage of economic output diverted to taxes, rather than per capita taxes. This measure has the added benefit of not needing to be adjusted for inflation.
- We use the most recent data released by the Census Bureau, which is for FY 2021 (July 1, 2020 – June 30, 2021). This is the second fiscal year affected by COVID-19, which has had a significant impact on everything, including state and local taxes.
STATES SAW A SIGNIFICANT INCREASE IN TAXES IN FY2021
 Source: Census Bureau, State and Local Government Finances and Bureau of Economic Analysis
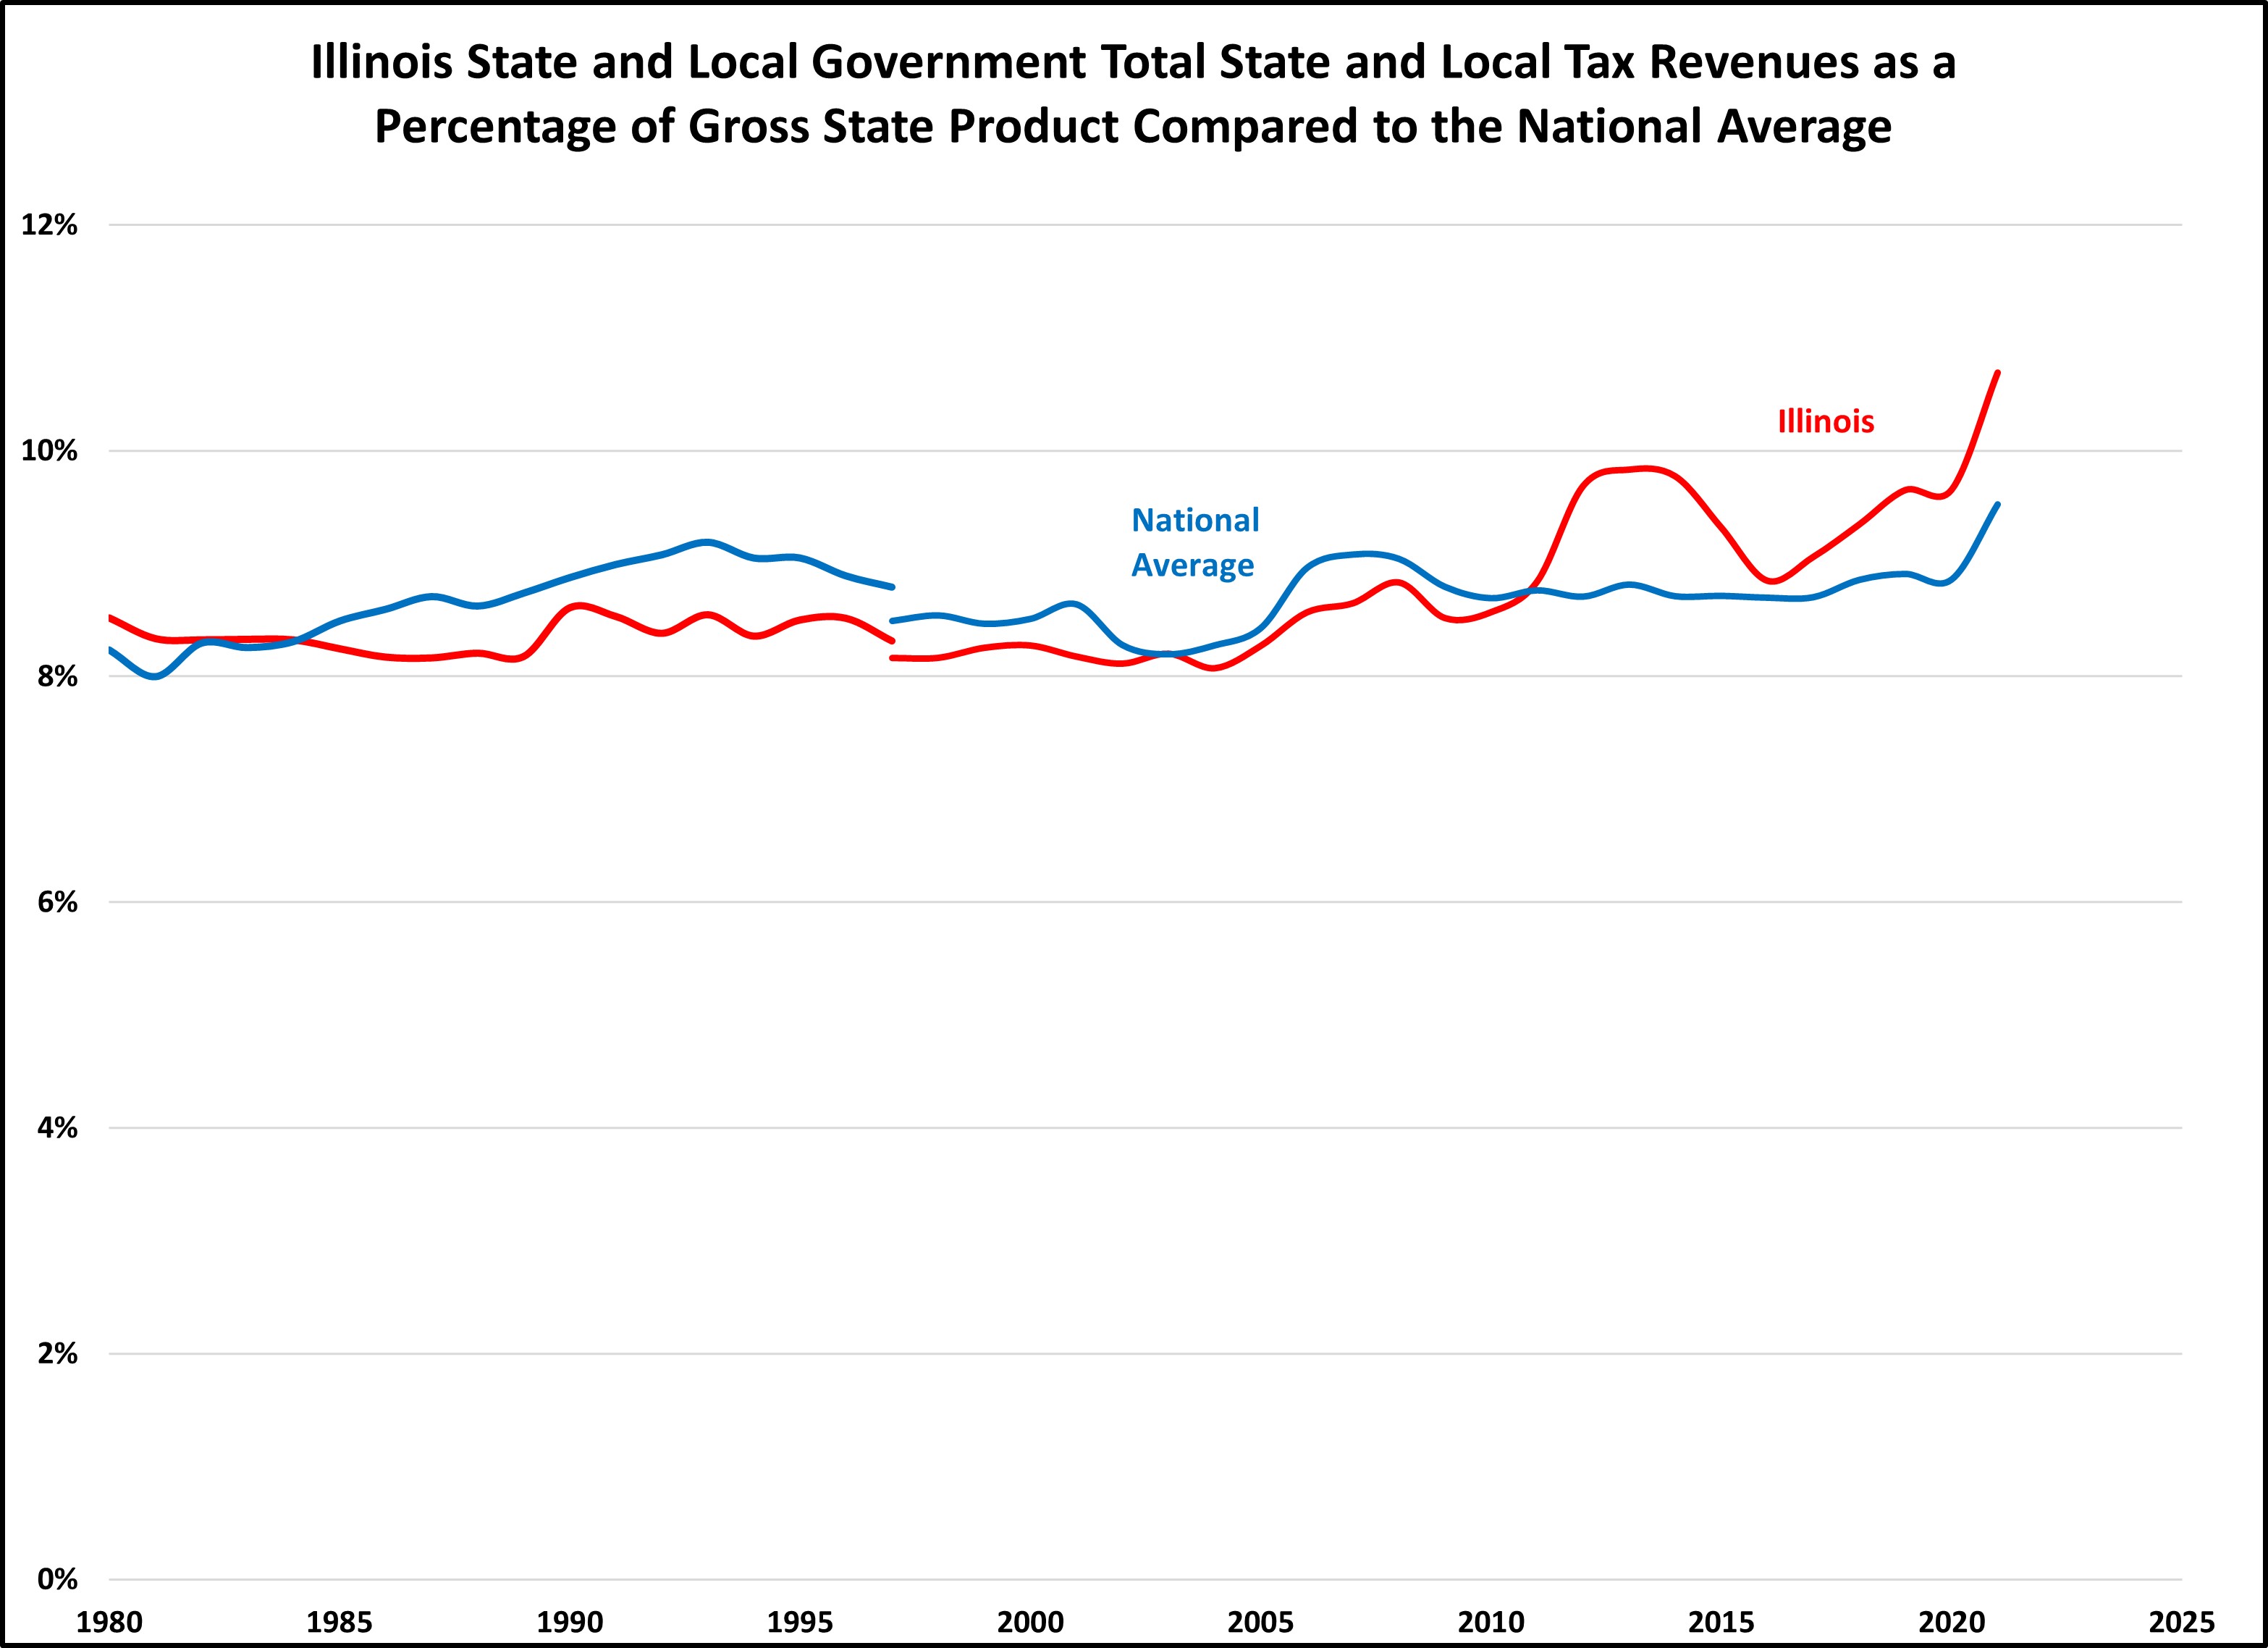
Illinois and states across the country saw a significant increase in taxes in FY2021. State and local taxes measured as a percentage of gross state product increased nationally by 8% and increased by 11% in Illinois.
Historically, Illinois’ total state and local tax collections as a percentage of gross state product has been slightly below the national average. Taxes in Illinois increased in 2011 when income tax rates temporarily increased and came down when the increase expired. In mid-2017, income tax rates were increased again, and the chart reflects the resulting changes in tax collections.
NOT ALL STATES SAW INCREASES IN REVENUES
Source: Census Bureau, State and Local Government Finances and Bureau of Economic Analysis
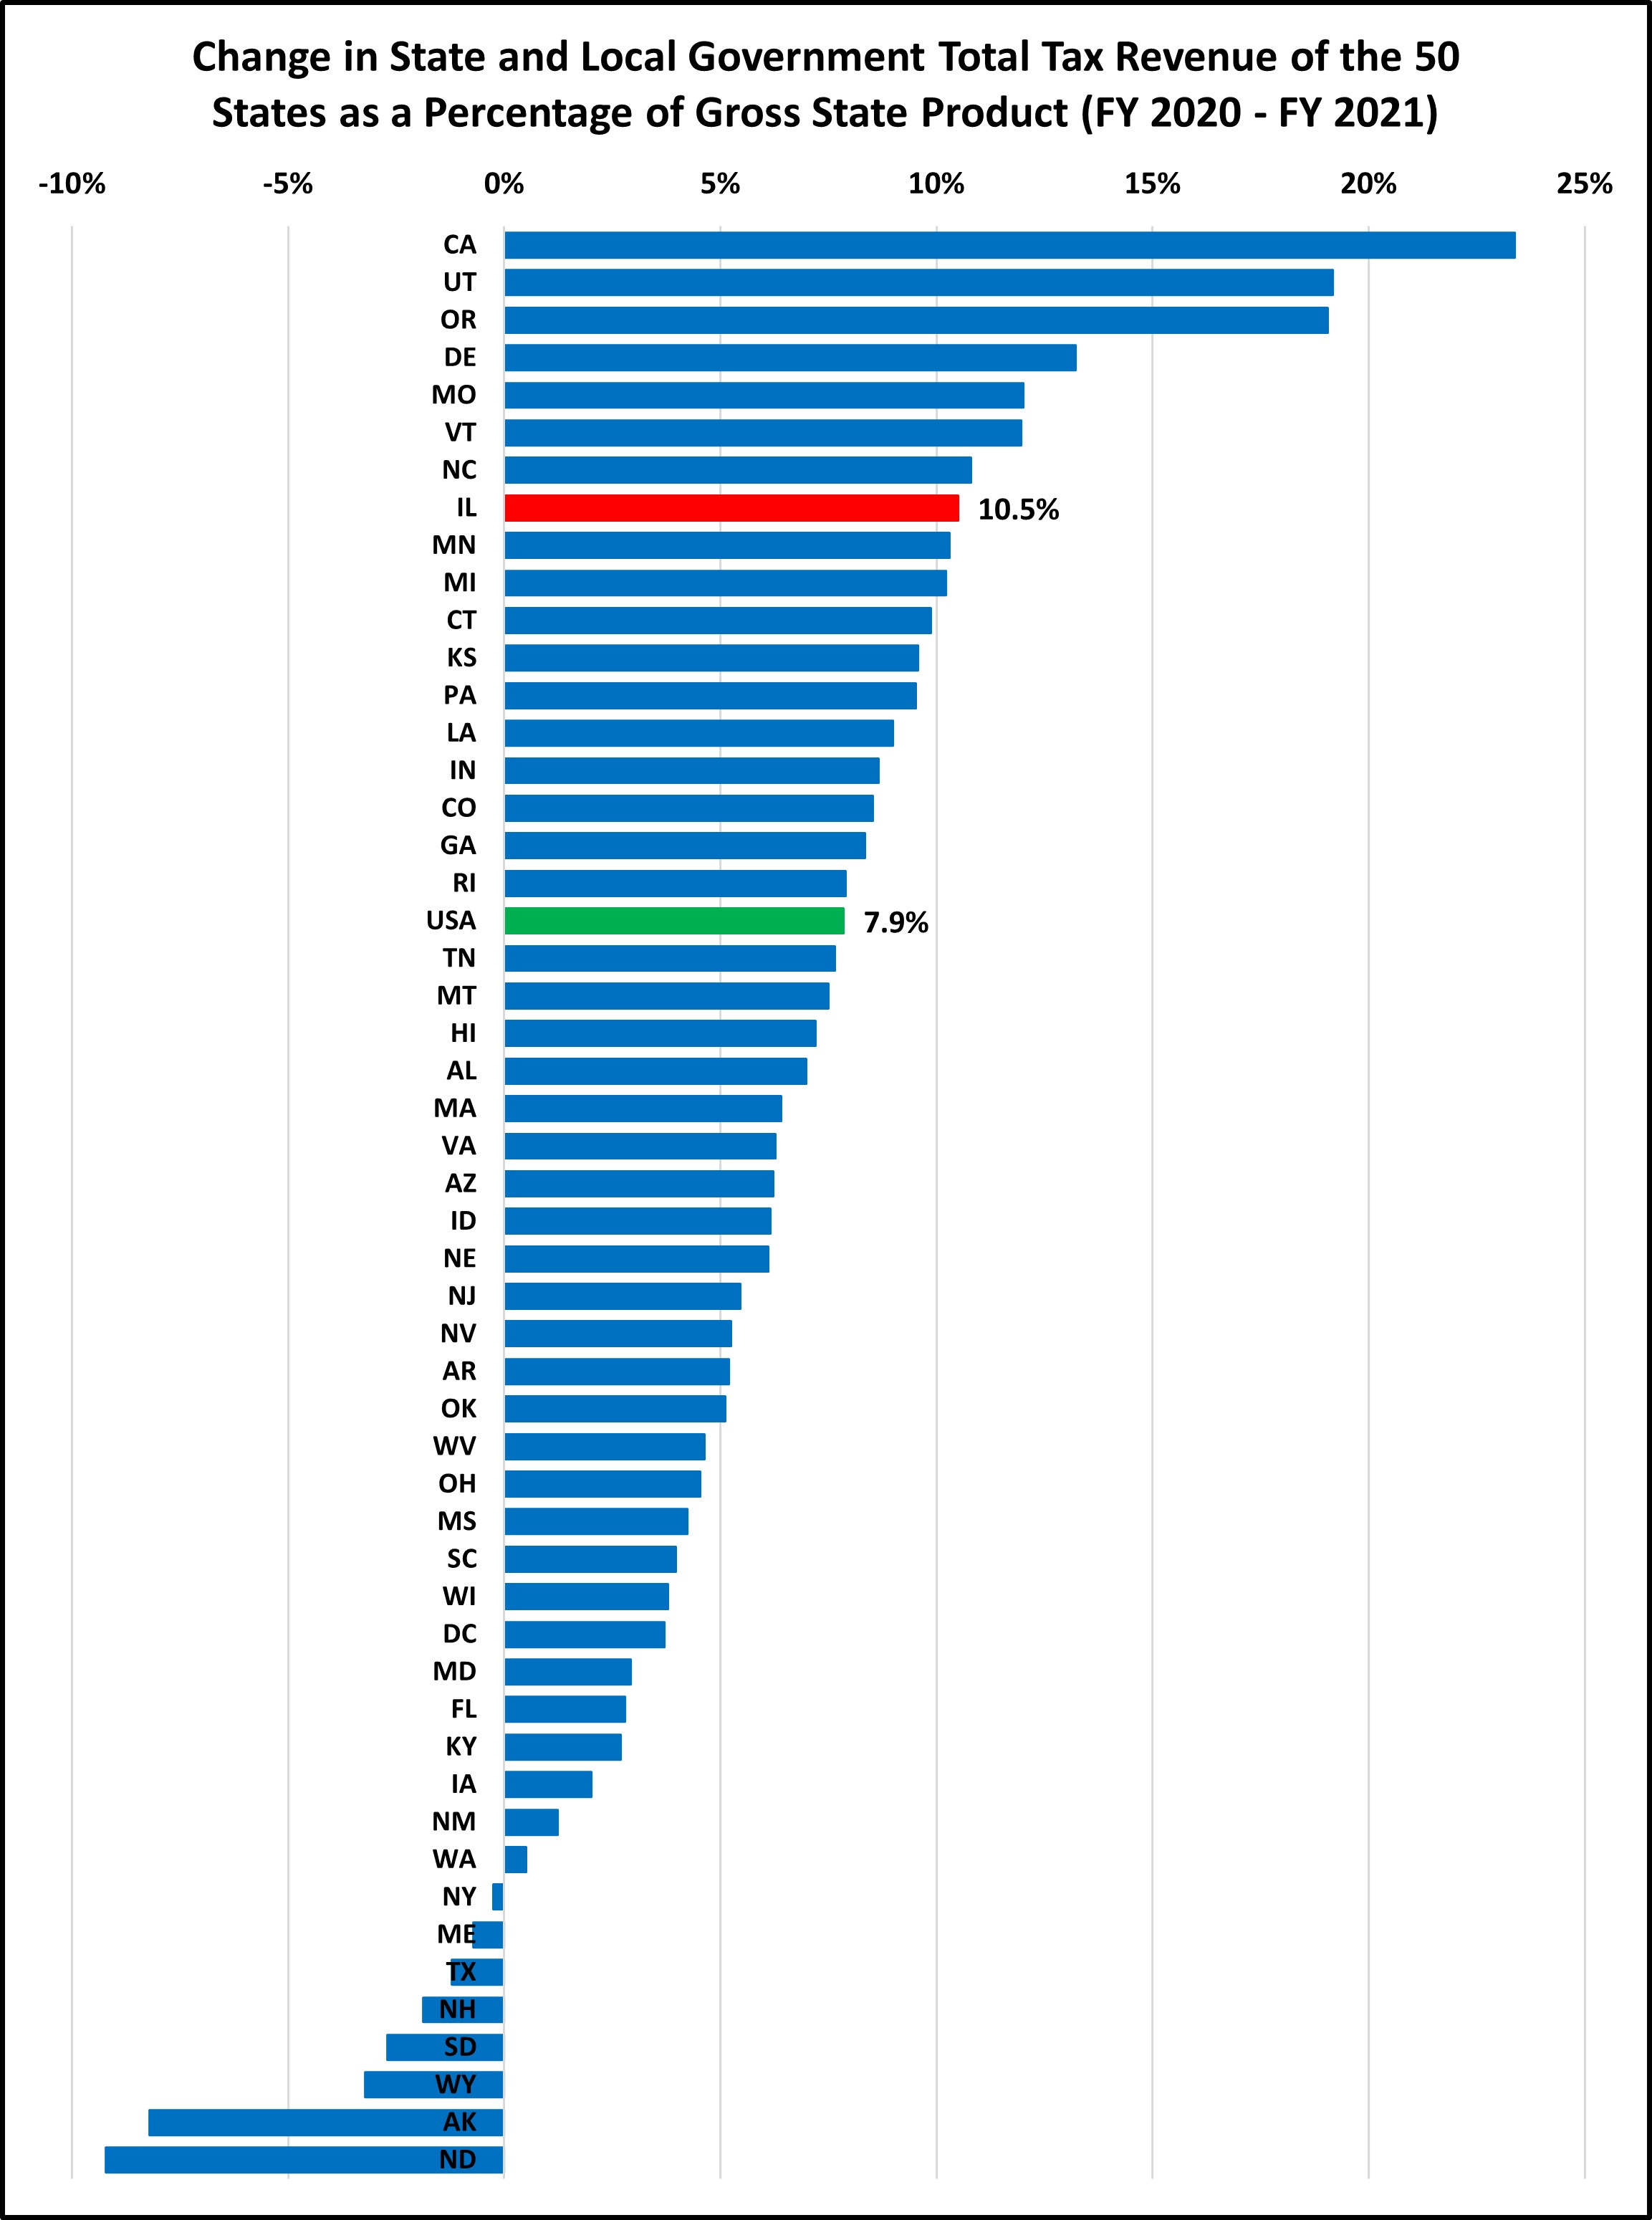
States saw a significant increase in taxes in FY2021. This chart shows that states without an income tax saw smaller increases or even a decrease in taxes. This is because of all the various tax types, individual and corporate income taxes grew the most. Illinois saw an above average increase in taxes which has helped our budget situation.
However, a number of states have used this windfall to reduce taxes going forward. It’ll be interesting to see how those tax reductions affect the different rankings in future years.
ILLINOIS TAXES ARE ABOVE AVERAGE
Source: Census Bureau, State and Local Government Finances
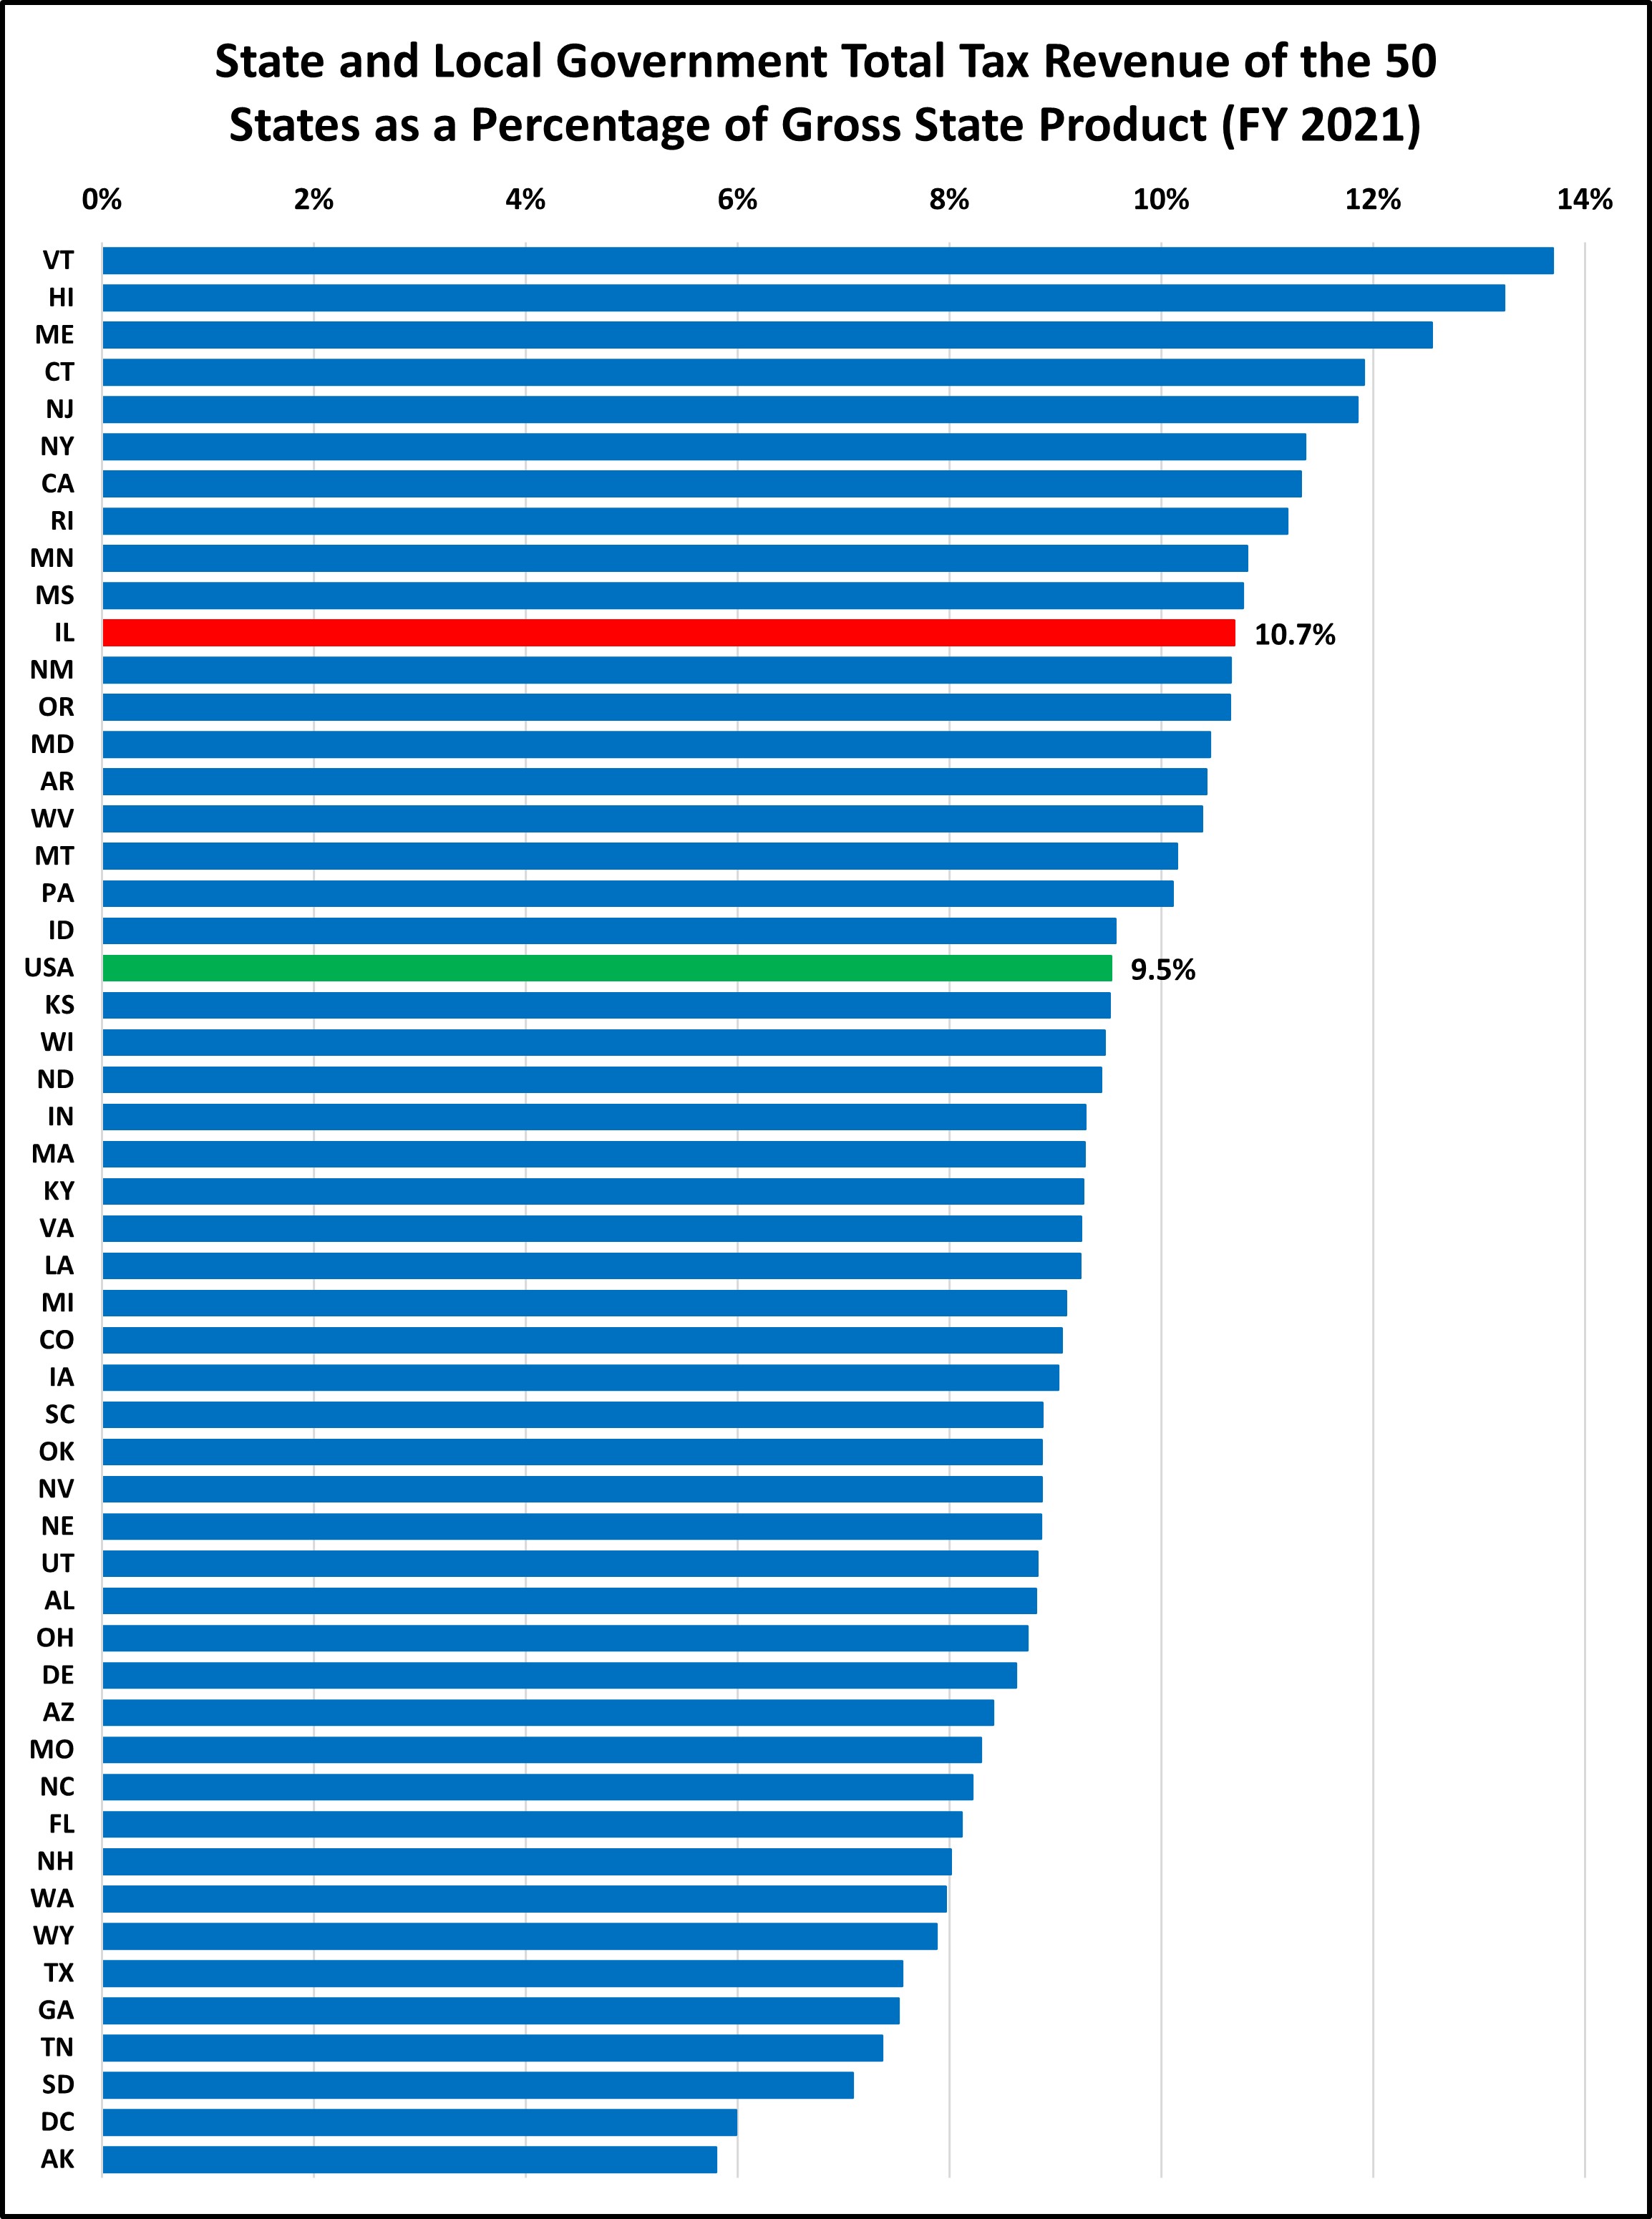
In FY2021, Illinois had the 11th highest total tax collections, when measured as a percentage of gross state product at 10.7%. In total, Illinois state and local governments collected almost $96 billion in taxes, which is $10 billion more than would have been collected had Illinois been at the national average.
PER CAPITA TAXES IN ILLINOIS ARE HIGH
Source: Census Bureau, State and Local Government Finances
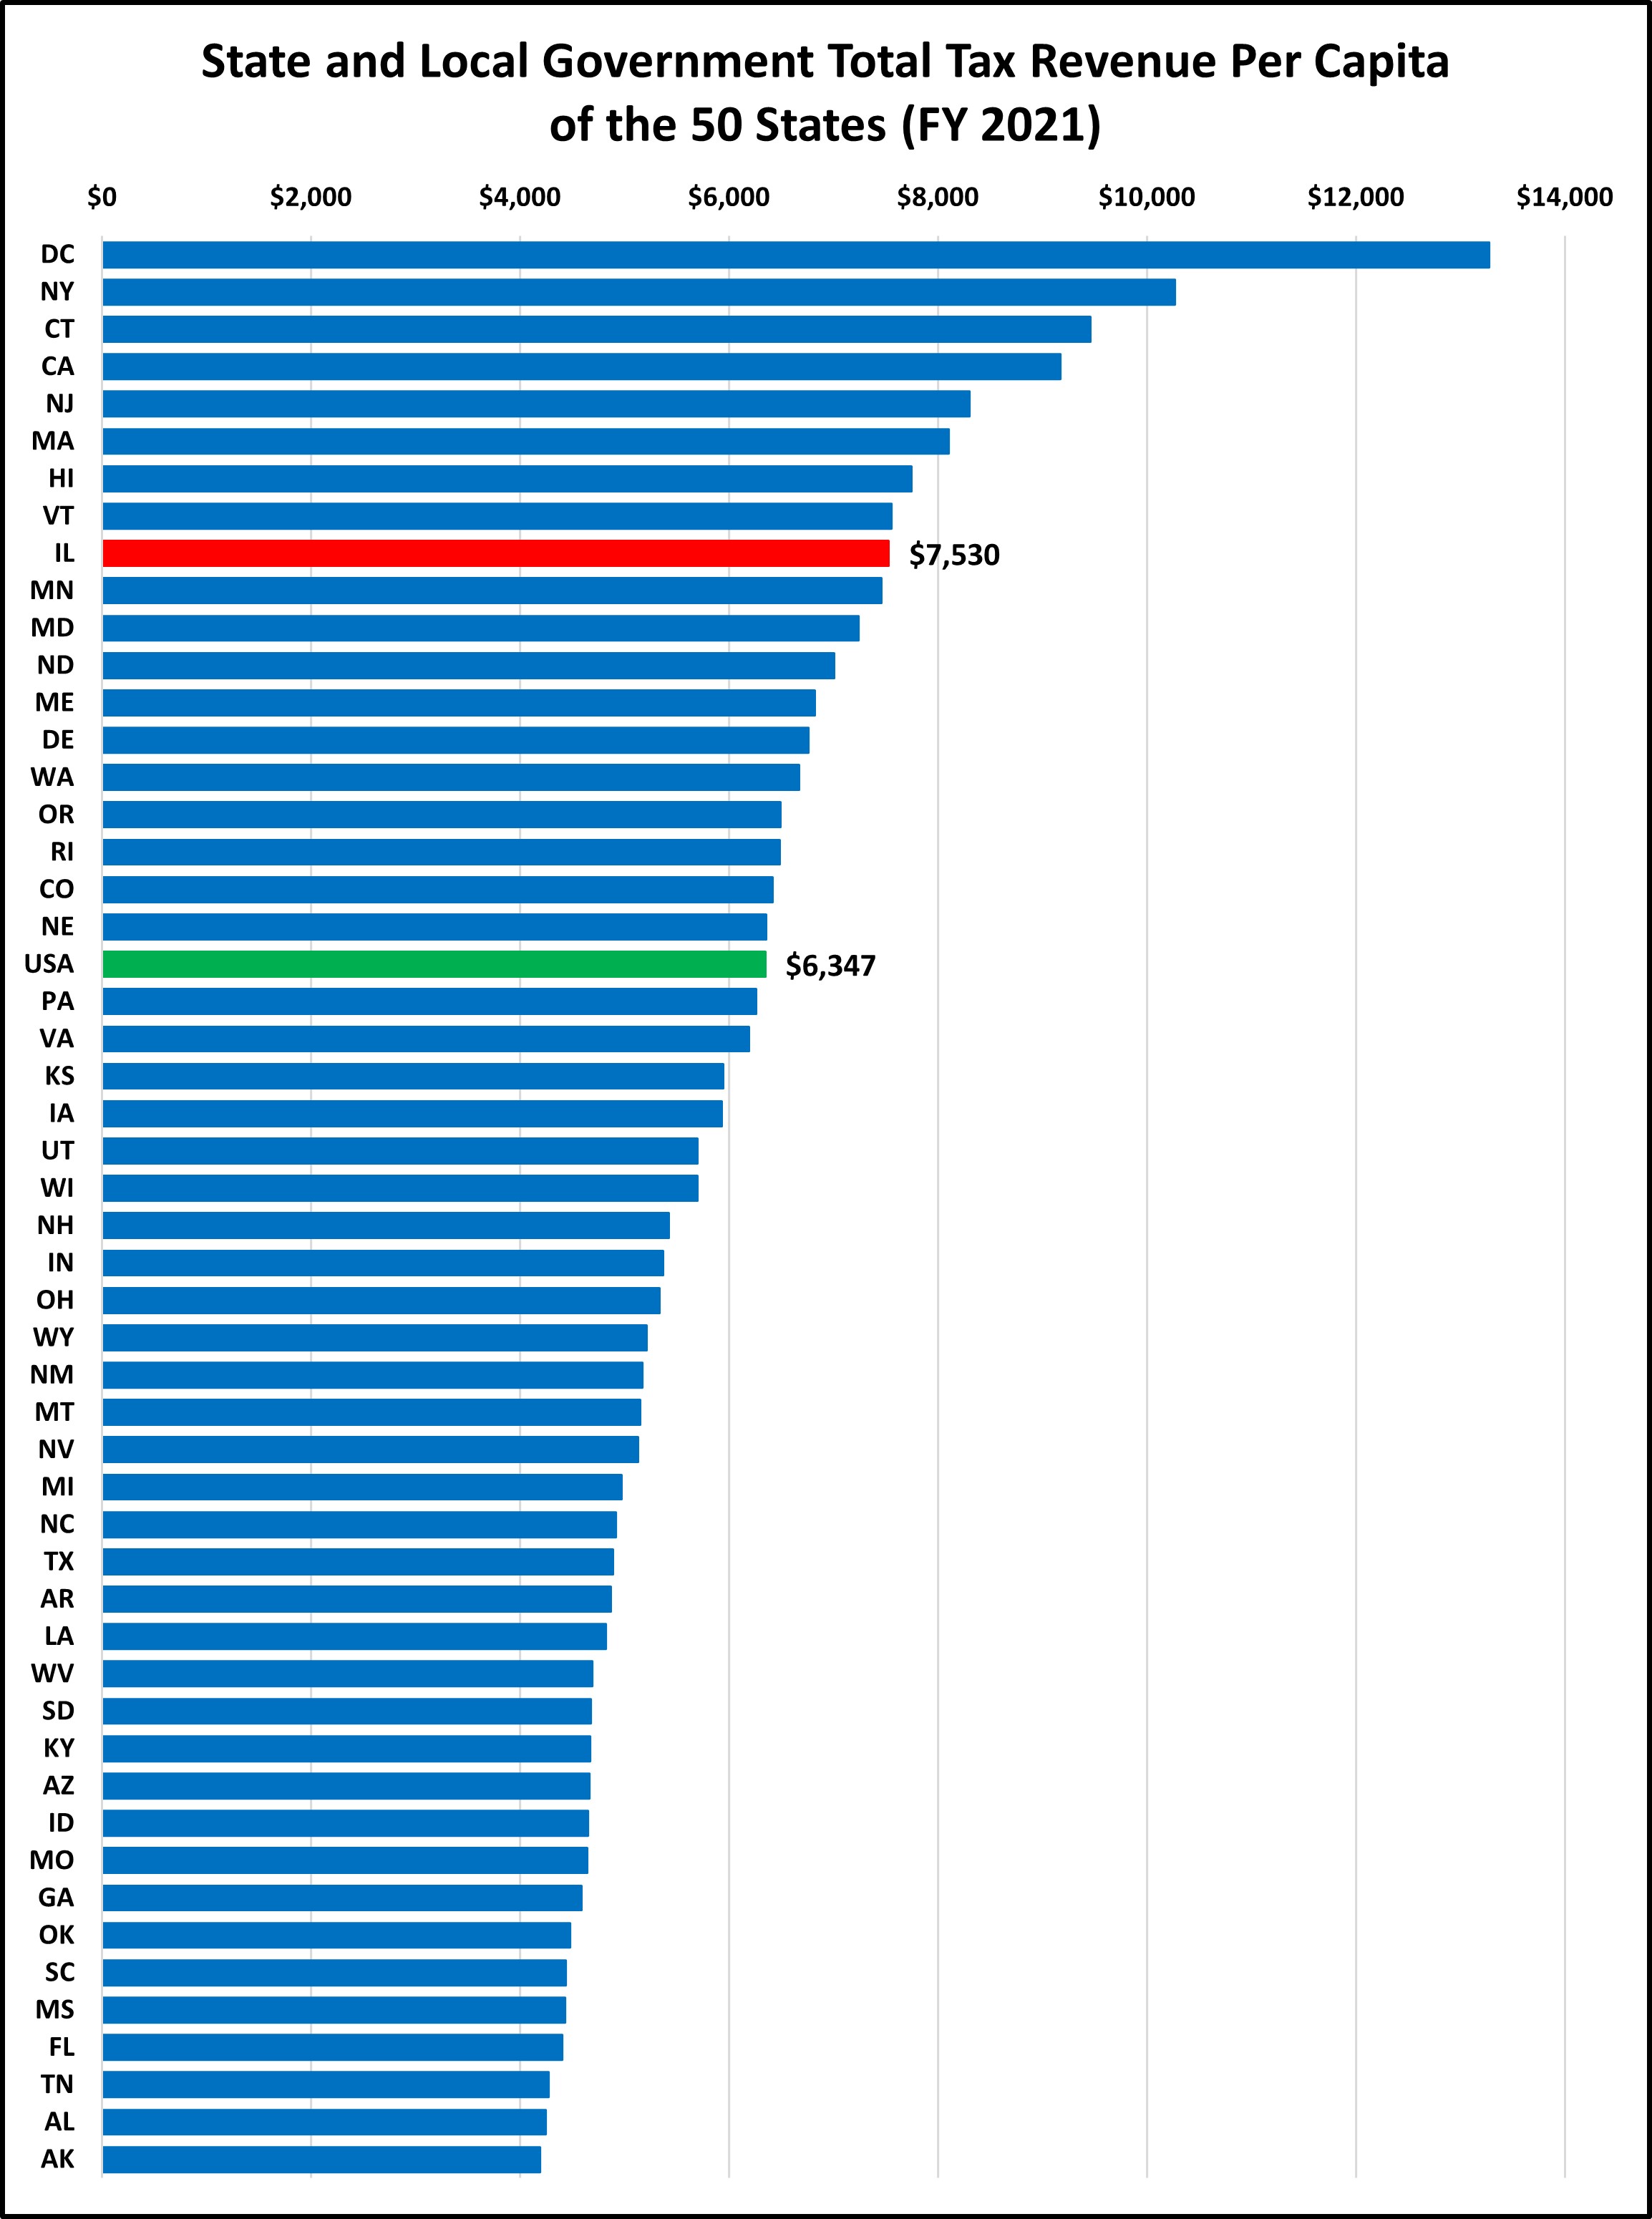
Although per capita measurements fail to consider the states’ different economies, they still have a purpose. When we say Illinois’ state and local taxes are 10.7% of gross state product, most people will gloss over the figure as it’s essentially a foreign language. Saying that Illinois’ state and local tax burden is $7,530 per person, on the other hand, is easier to understand (even though few people would pay this exact amount). The national average per capita state and local tax collection is $6,347. The national average increased by $697 from FY2020, whereas Illinois saw an increase of $928.
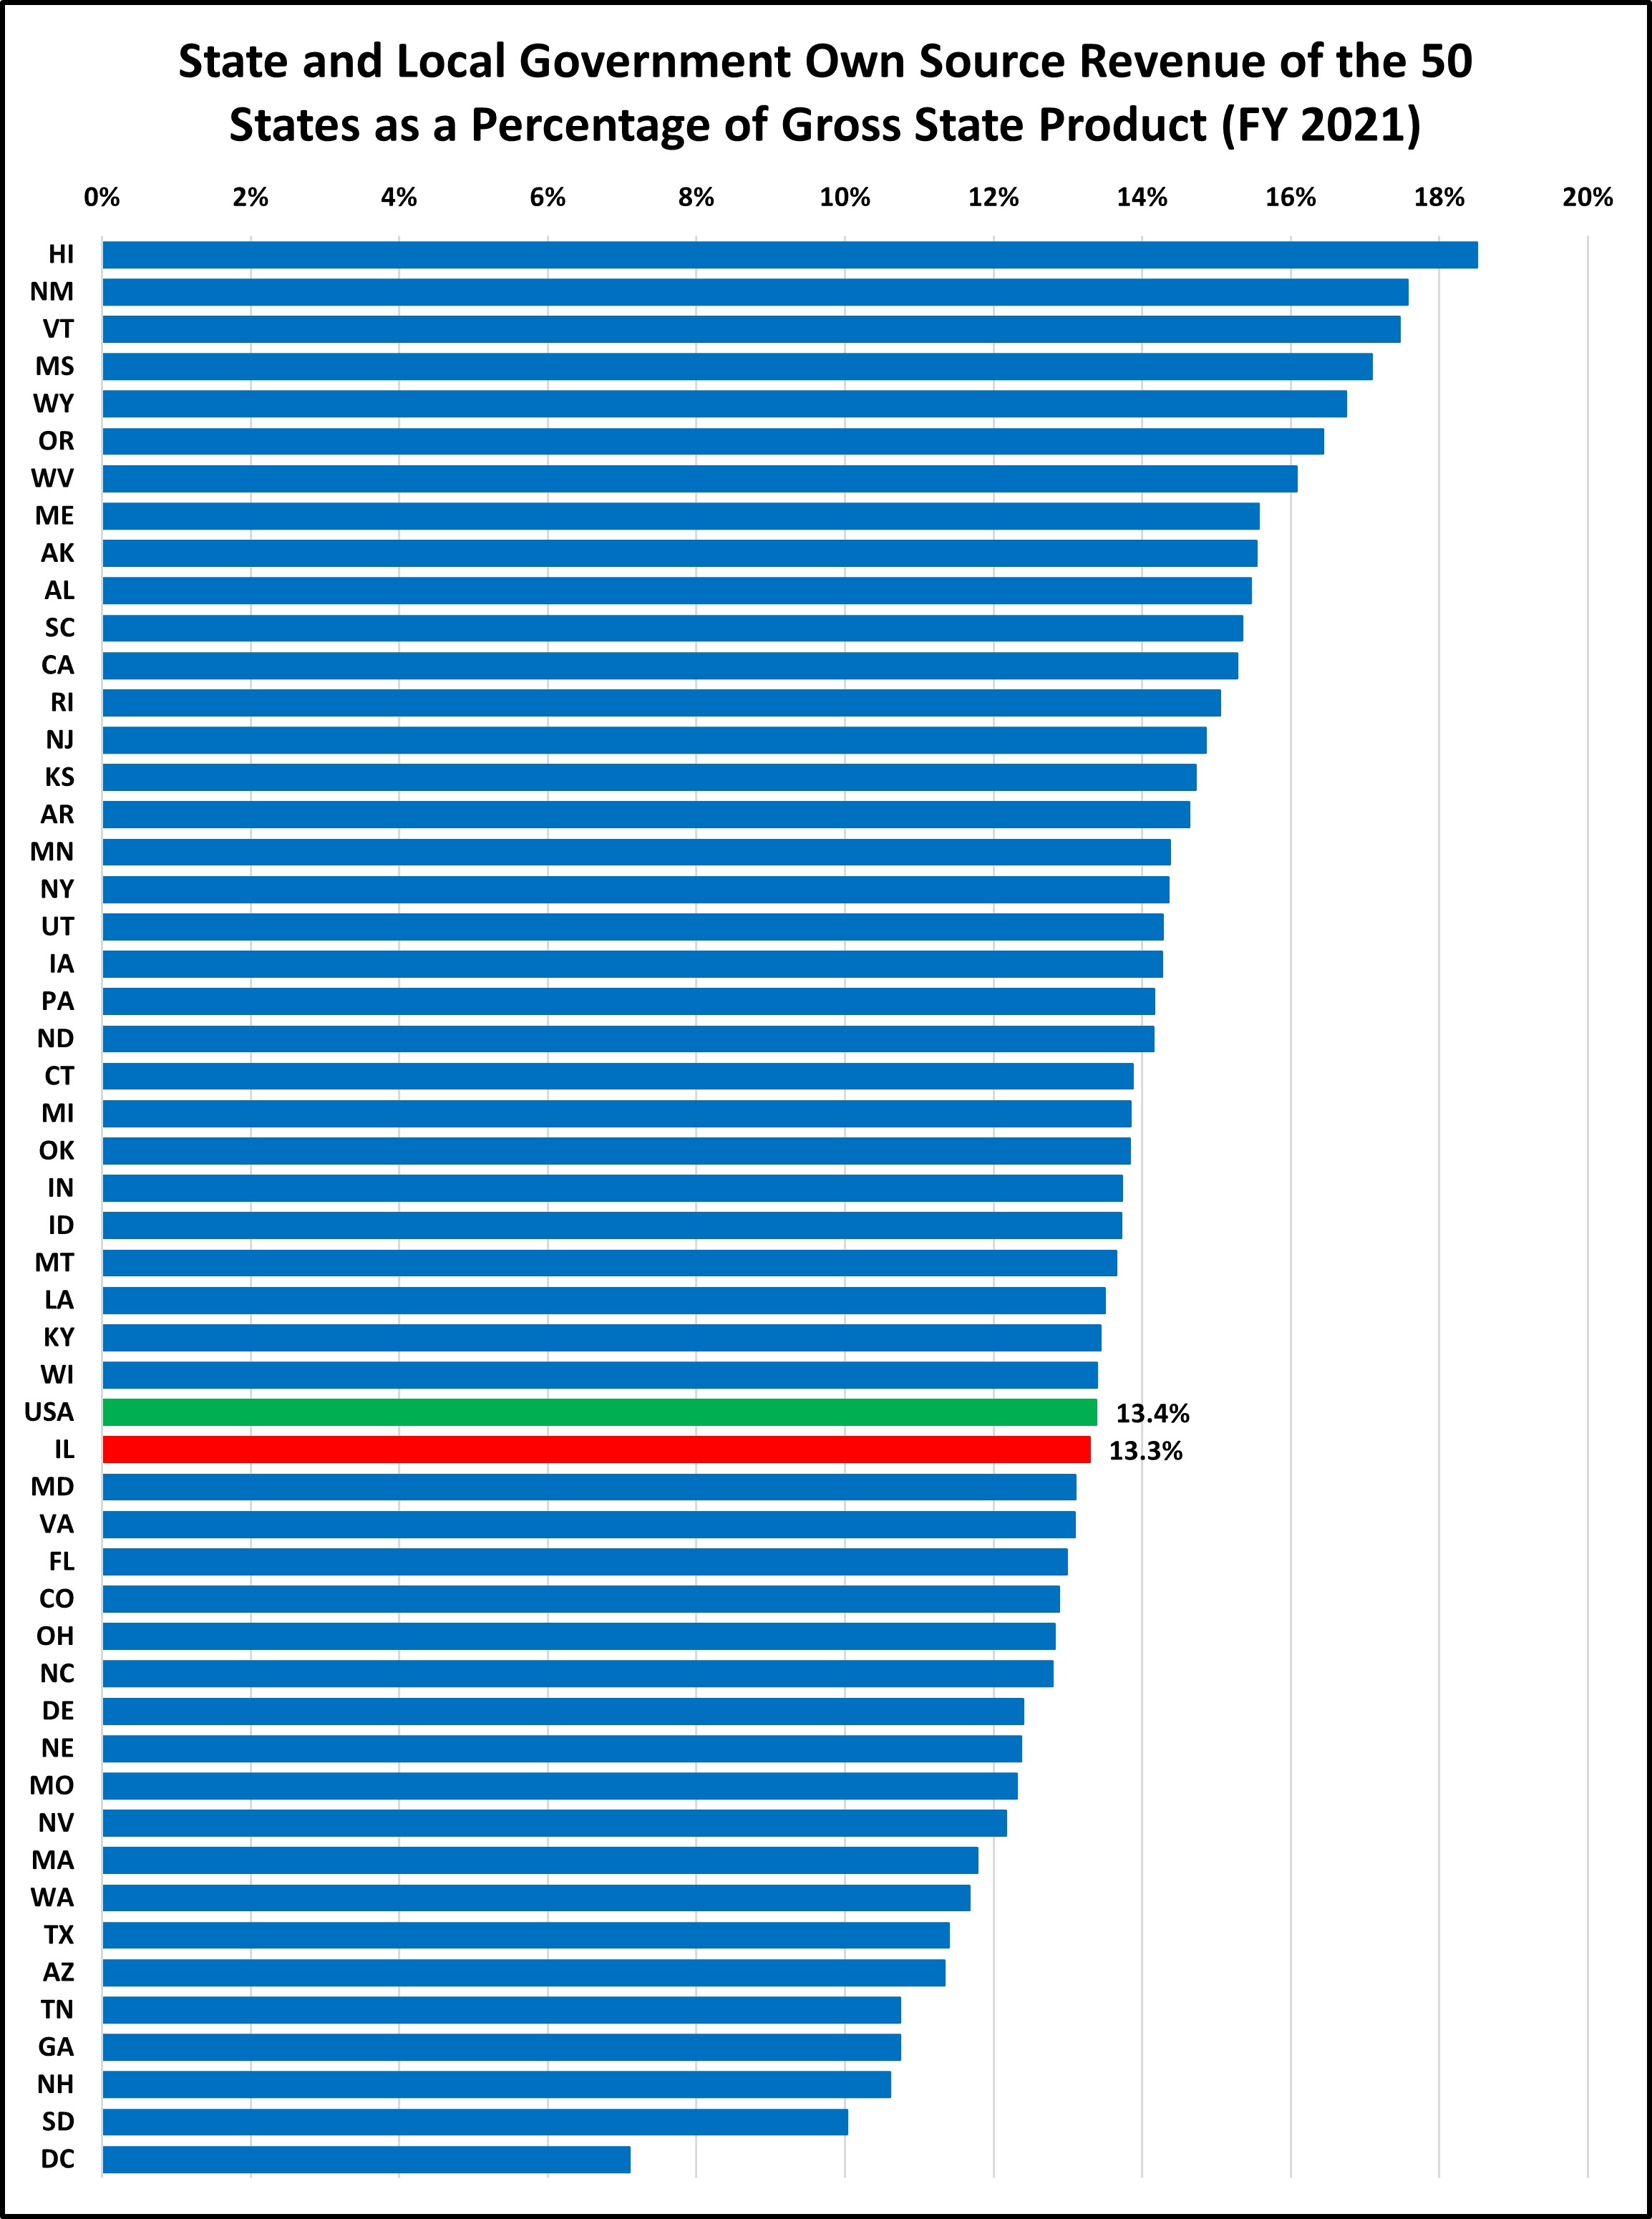
ILLINOIS OWN SOURCE REVENUES SEEM TO TELL A DIFFERENT STORY
Source: Census Bureau, State and Local Government Finances and Bureau of Economic Analysis
So far, we have compared total tax collections in Illinois (which includes income, sales, property, excise, utility, and other miscellaneous taxes) to collections in other states. We have not looked at other revenues that state and local governments receive, such as fines, fees, college tuition, tolls, and other similar revenues. Some argue that a more inclusive figure, that includes taxes and fees (the U.S. Census uses the term own-source revenue), is a better measuring stick, since a person doesn’t care if a payment they make to a government is a fee or a tax–it is still going to the government. However, most fees are for a specified service (or should be), such as students paying tuition to attend a state university or a driver paying a highway toll. And the revenues from these fees are generally used to fund that specific service (the university or highway), rather than for general government purposes. Even so, it can be useful to look at this more inclusive figure, which shows that Illinois is essentially at the national average.
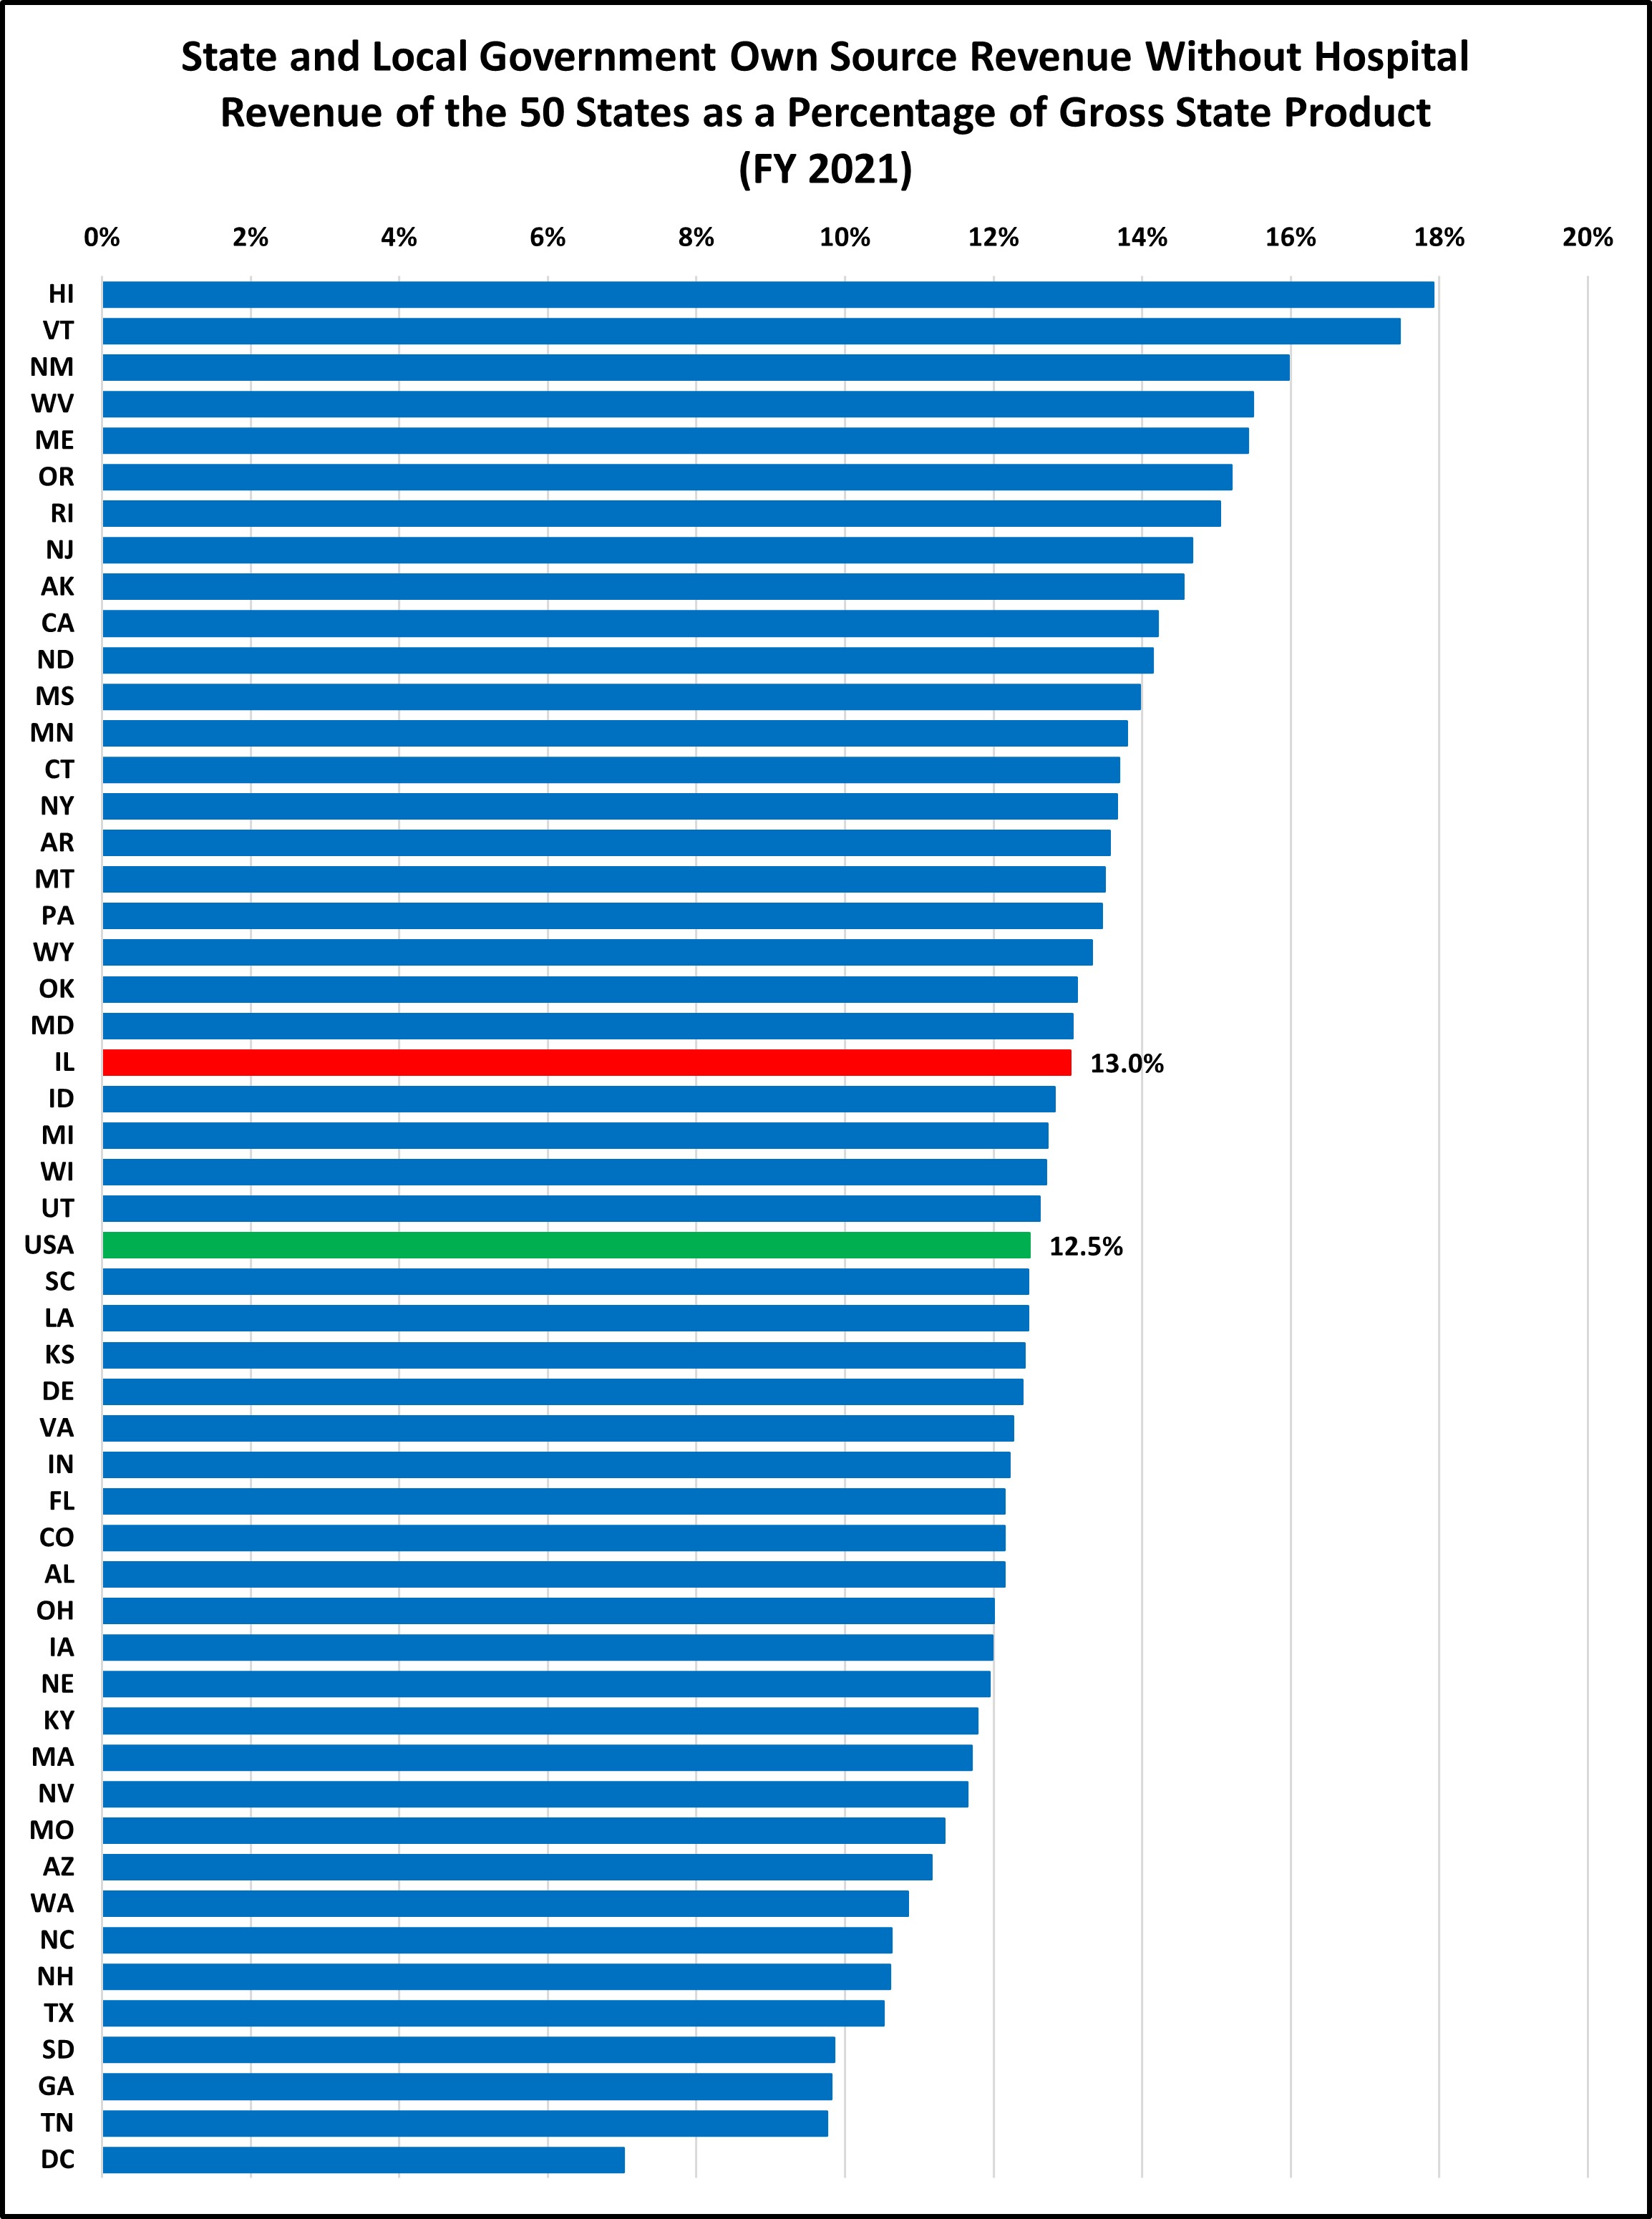
Tax revenues are above average, according to the previous charts, but total own-source revenues are average, which seems contradictory. What is driving this difference? Own source revenue does not include revenues from government run utilities and liquor stores, but it does include revenues from government run hospitals. Illinois’ state and local governments collect only $178 per capita from government run hospitals while the national average is $598 per capita. Nationally, 18% of hospitals are run by state and local governments. In Illinois, that figure is 13%, which explains our below average amount. If Illinois were at the national average, our state and local governments would collect an additional $5.3 billion in gross revenue from government-run hospitals. However, governments that collect hospital revenue need to provide medical care in exchange for those payments. To increase the hospital revenue figure, our state and local governments would also have to increase the number of, and amount of expenditures on, government hospitals. Increasing hospital revenues would not guarantee any additional funding for other state functions or otherwise alleviate Illinois’ tax burden.
While this own-source revenue comparison may be useful for some purposes, understanding it requires looking at what is driving the difference: where is Illinois significantly below average, and where are we significantly above average. In this case, Illinois’ below average ranking is mainly due to fewer government operated hospitals in Illinois, as shown by the next chart.
REMOVING HOSPITAL REVENUE RAISES ILLINOIS RANKING
Source: Census Bureau, State and Local Government Finances and Bureau of Economic Analysis
When government hospital revenue is removed from the own source revenue data, Illinois’ ranking increases. Illinois went from average to slightly above average.
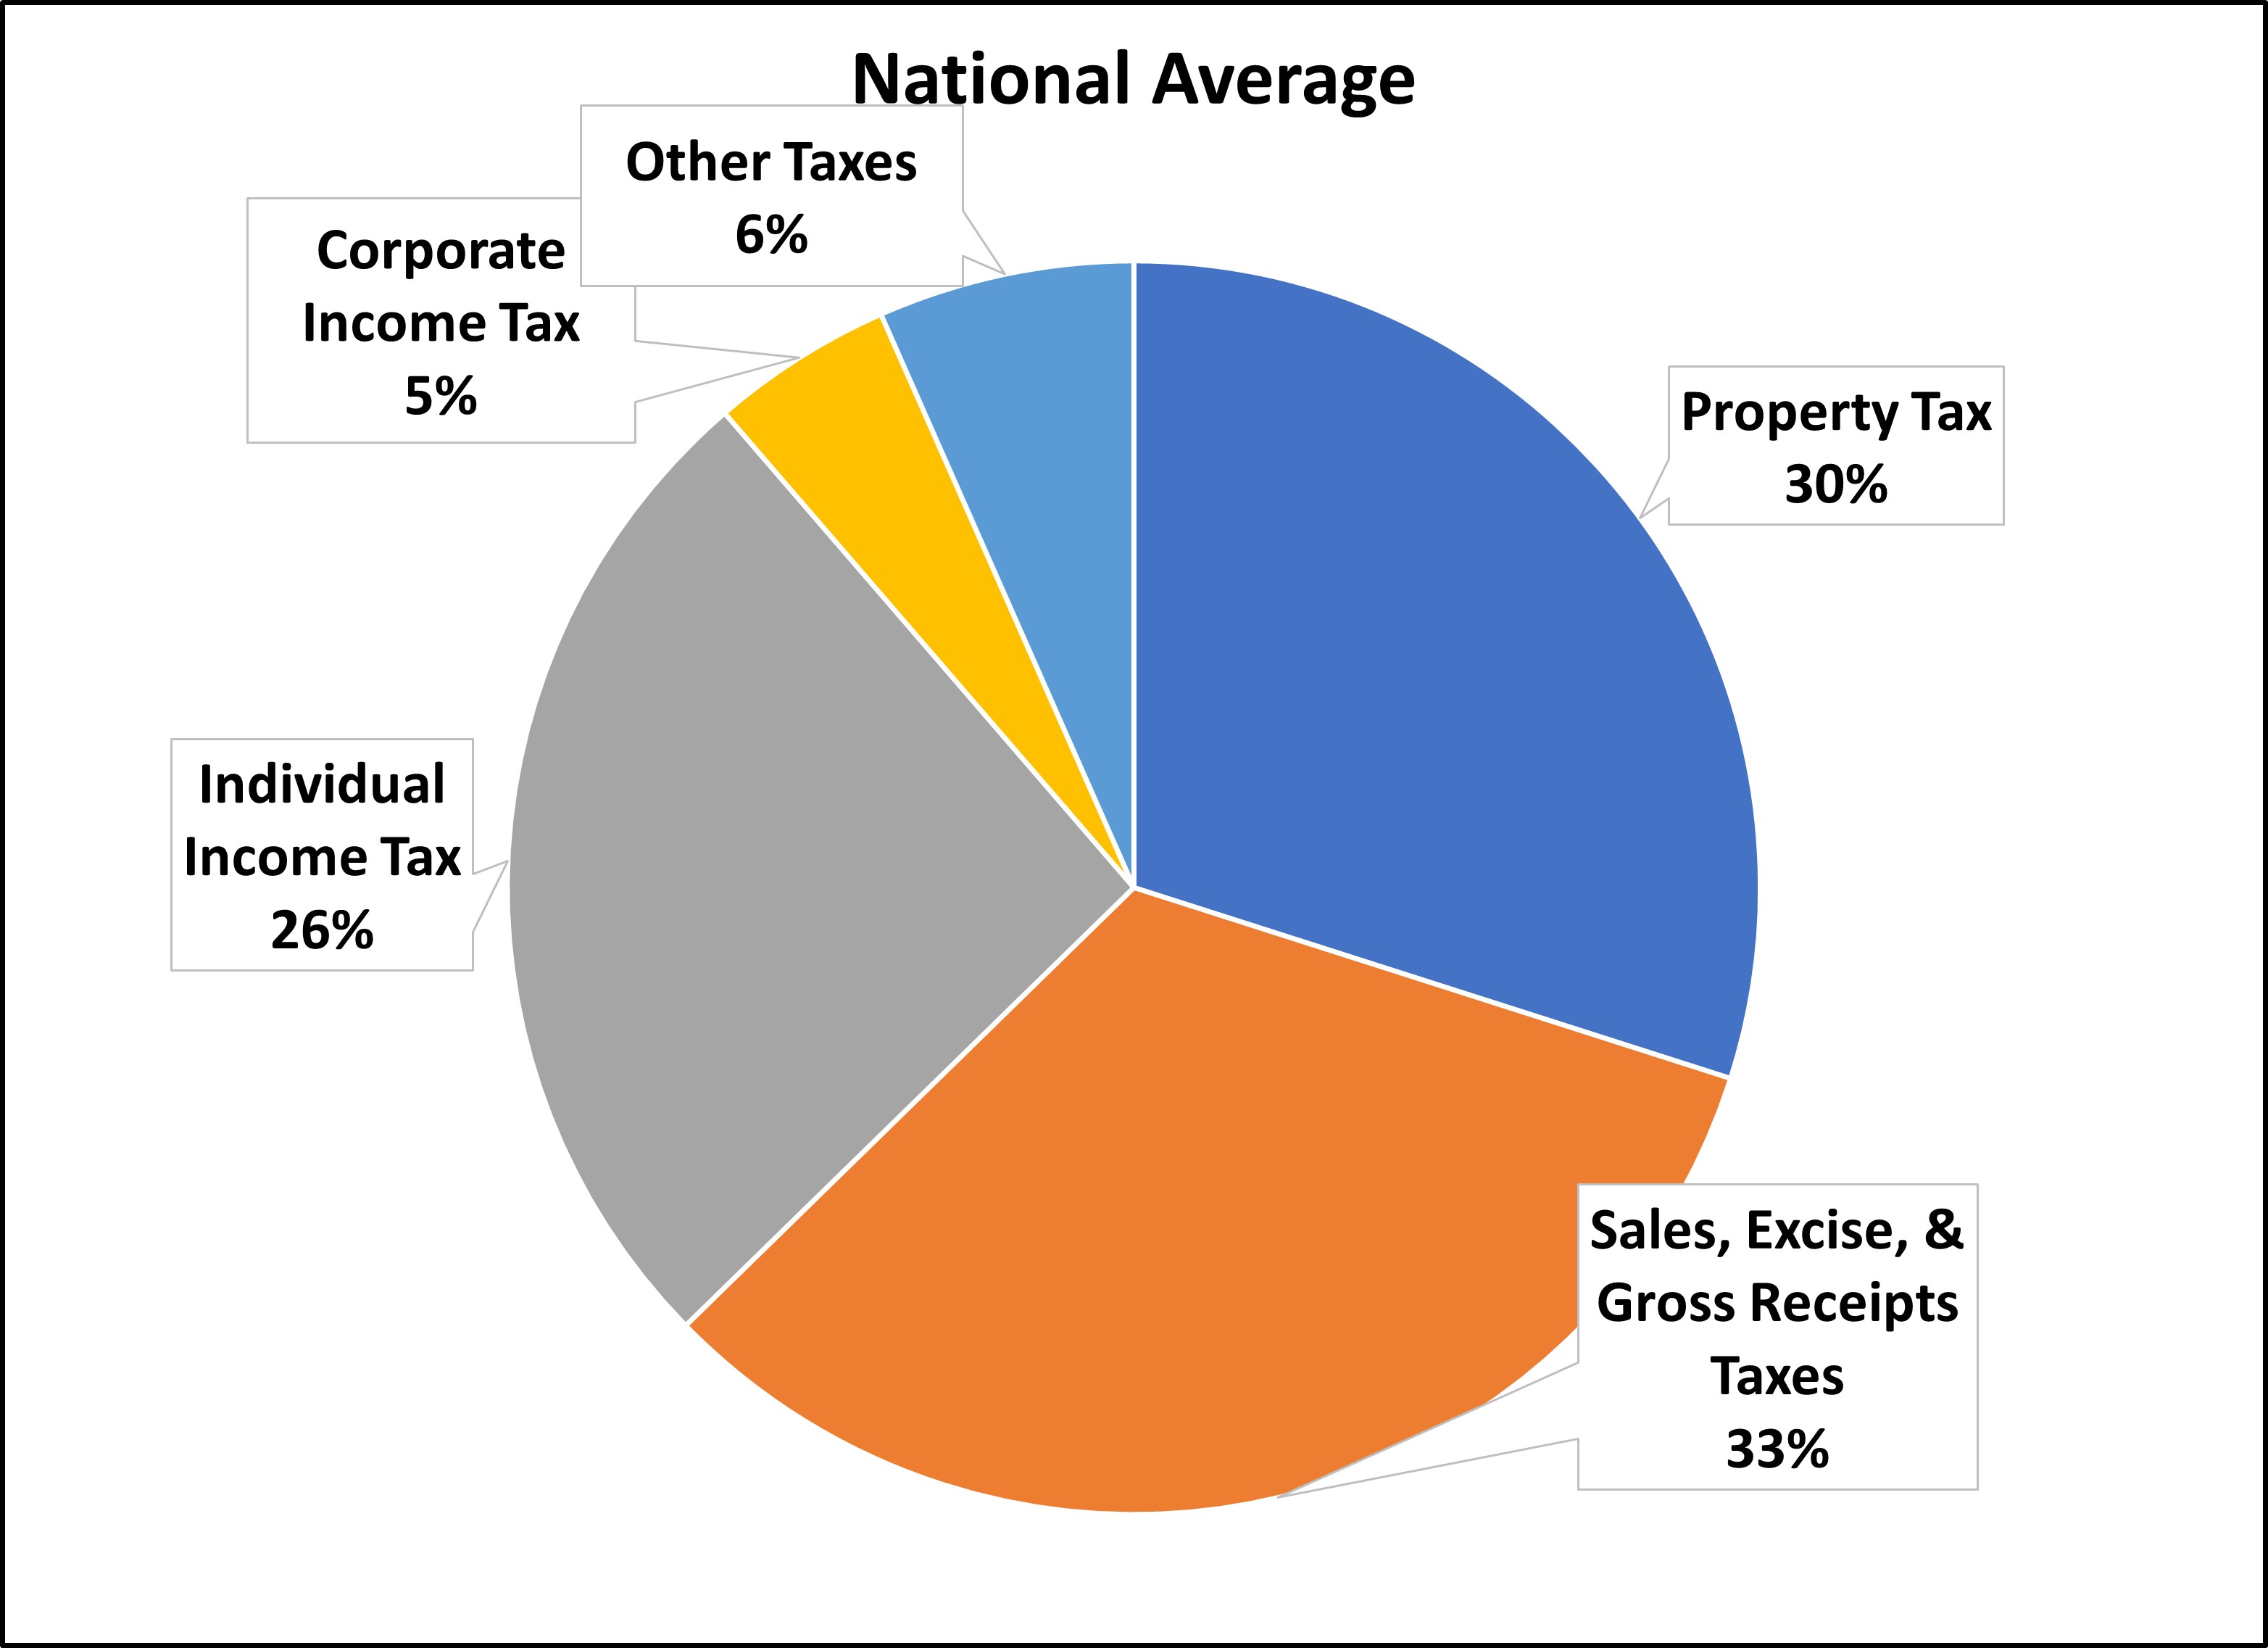
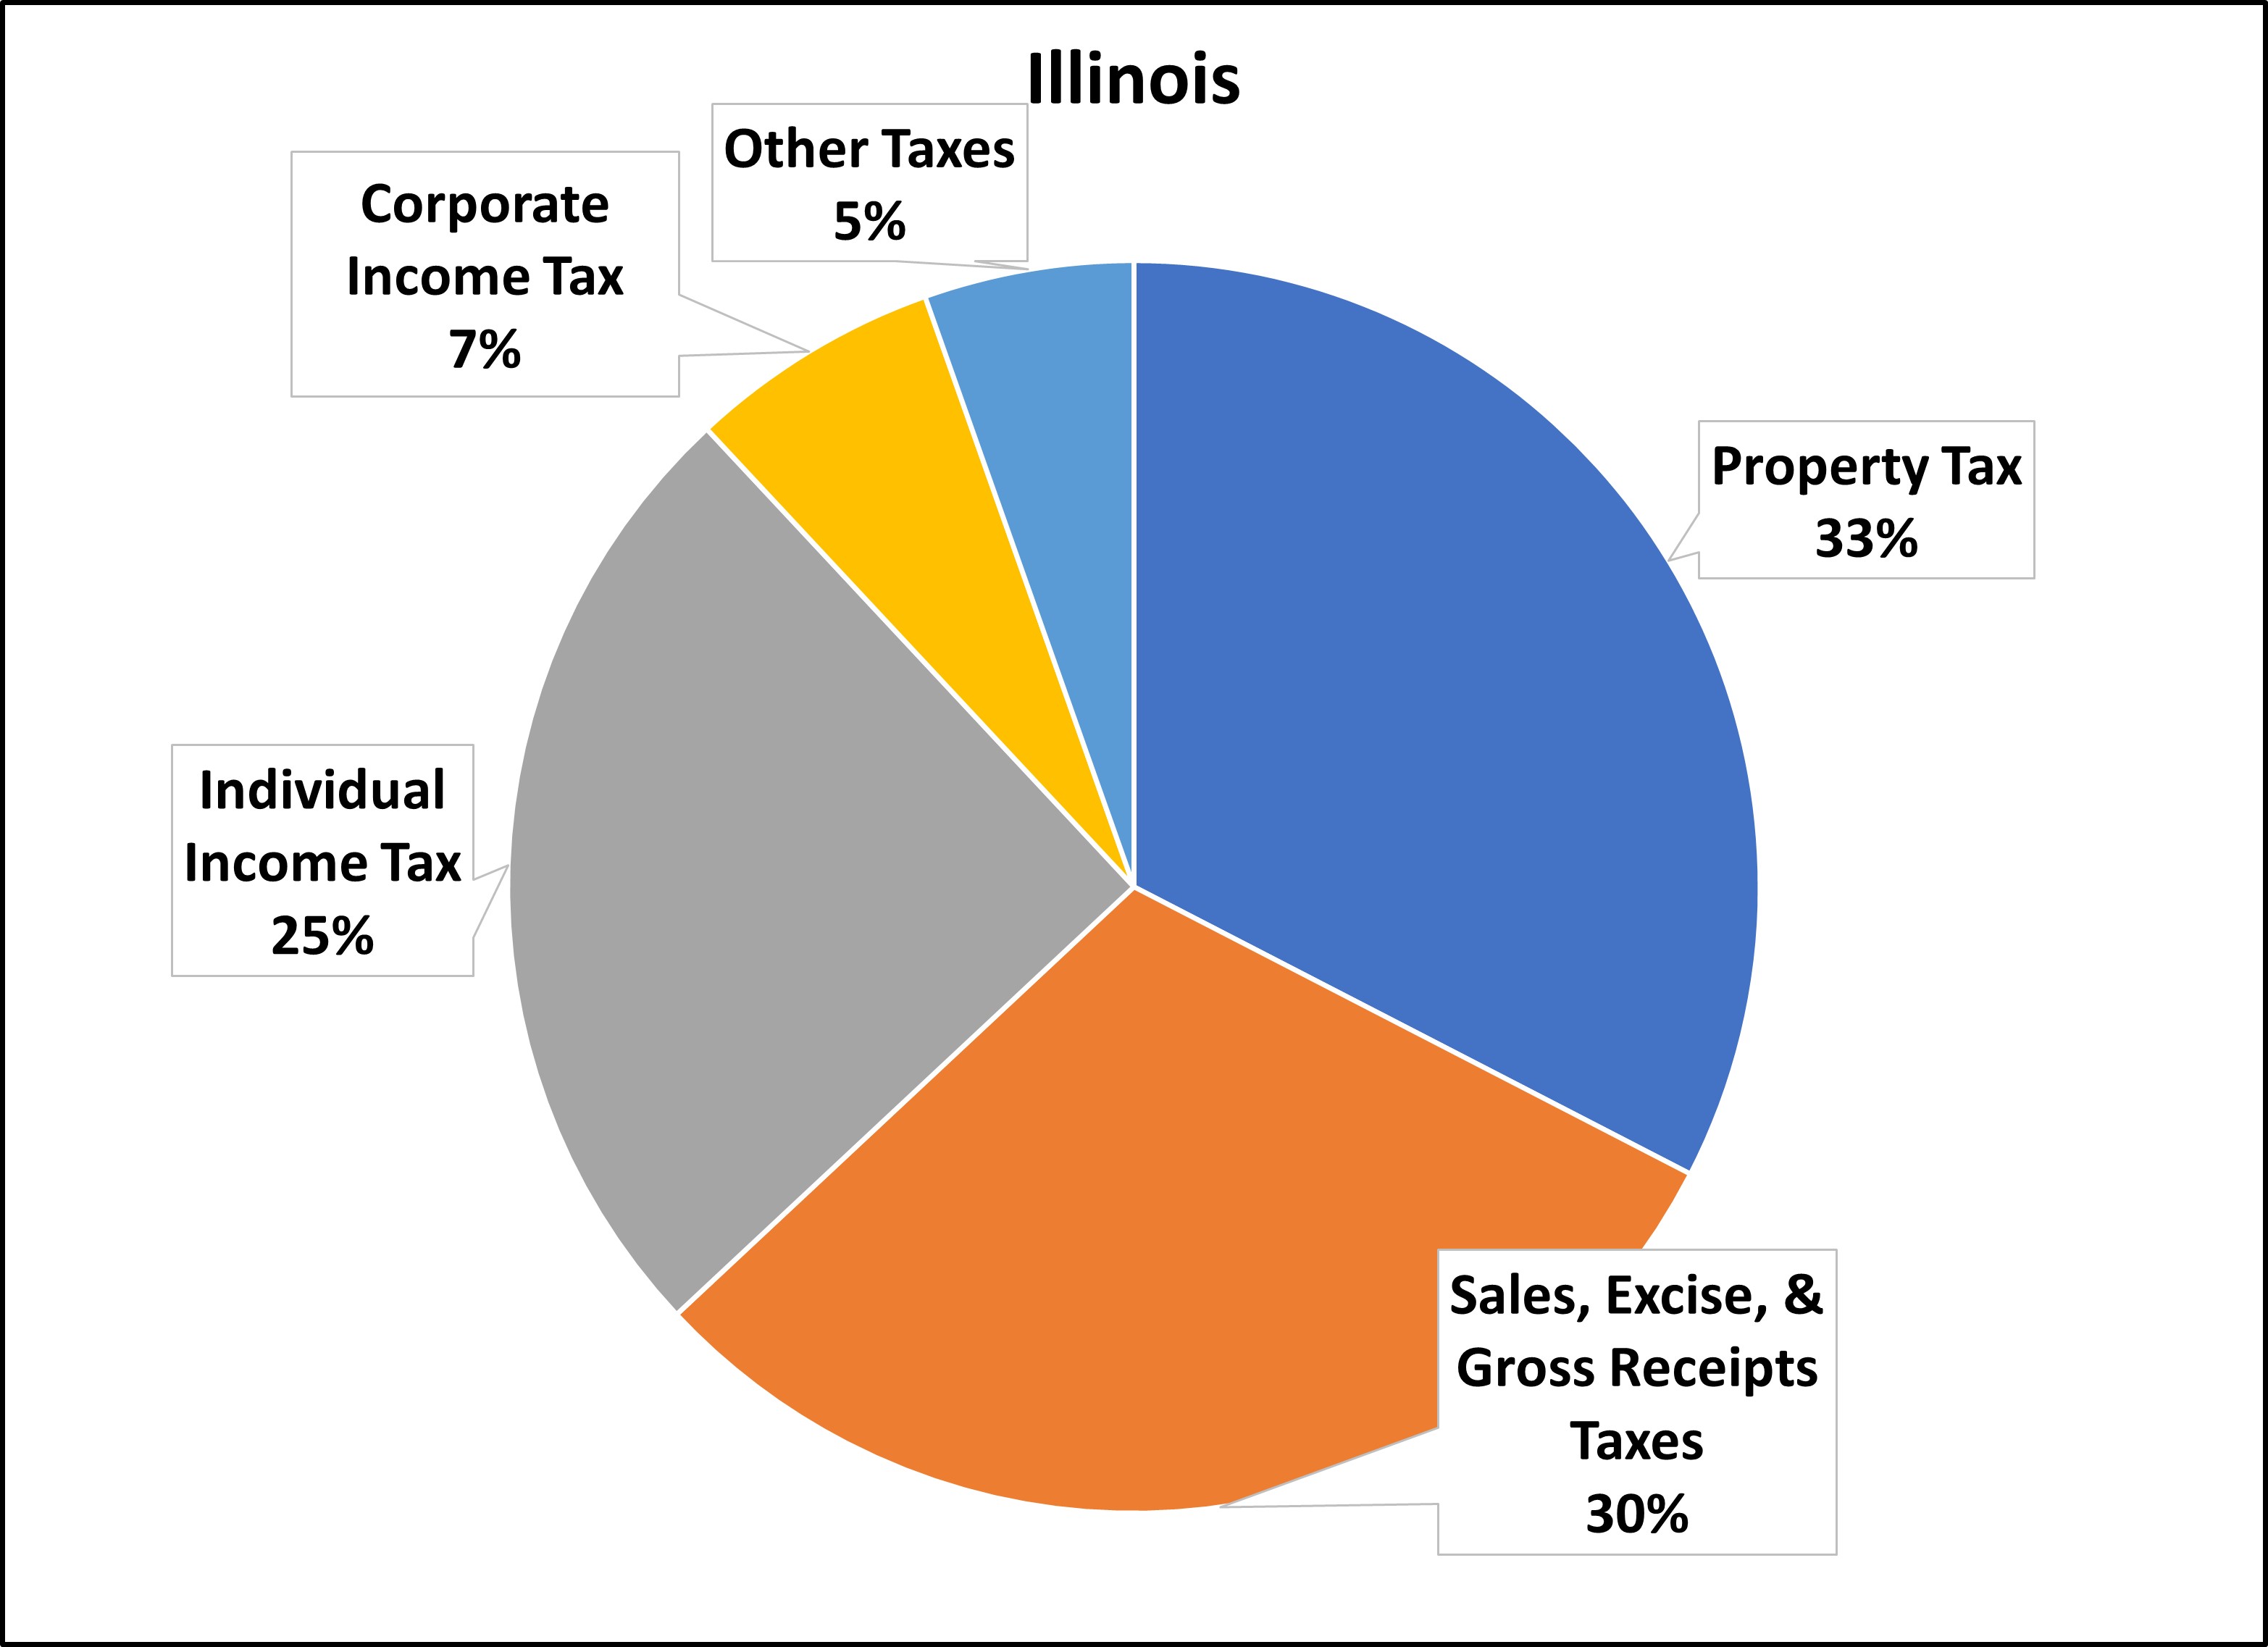
THE MAKEUP OF ILLINOIS’ TAX SYSTEM IS FAIRLY TYPICAL
Source: Census Bureau, State and Local Government Finances
These charts show the extent to which Illinois relies on certain taxes compared to the national average. Overall, the relative makeup of Illinois’ total tax collections is comparable to that of other states. Illinois relies on property taxes more so than the average state, which shouldn’t be too much of a surprise to Illinois residents. Conversely, Illinois relies less on sales, excise, and gross receipts taxes than the average state, although these differences aren’t huge when viewed in this way. States that do not impose an income or sales tax would naturally have very different looking charts.
It is interesting to note that while overall taxes increased by 13% nationally in FY2021, individual income taxes increased by 28% and corporate income taxes grew by a staggering 63%. We will take a closer look at these specific tax types in future issues, but as these charts suggest, Illinois did not differ dramatically from these national trends.
CONCLUSION
Are taxes in Illinois high? The answer is complicated, as is often the case when you ask a tax-related question.
When you look at the overall state and local tax burden, as we have done in this article, taxes in Illinois are above the national average, using most measuring sticks. For those who believe taxes are too high, this shows that there is definite room for improvement. On the other hand, they aren’t the highest in the nation, and for those who seek additional government spending for various projects, this shows capacity to raise taxes instead. Holders of these differing viewpoints may not be blind, but they frequently choose to look at things from a singular perspective, much like the blind men in our opening story.
In future issues of Tax Facts, we will take a deeper dive and show how Illinois compares to the rest of the country focusing on specific tax types: income, sales, and property taxes. And we will continue to present a variety of ways to answer the question: are taxes in Illinois high?
METHODOLOGY
Charts like these are only as good as the underlying data. We consistently rely on data from the United States Census Bureau, specifically, the Annual Survey of State and Local Finances. Some states have taxes which do not fit neatly into a category, such as Washington’s Business and Operations Tax, a gross receipts tax on businesses. Some might think it should be classified as a corporate income tax. However, the census classifies it as a sales and excise tax. There are other instances where the Census guidelines and classifications may not be intuitive, but for simplicity and consistency, we follow the Census classifications.
We are aware of flaws in the Census data. The sales tax data for Illinois was incorrect for approximately twenty years. Recently, there has been a mistake with Illinois’ individual and corporate income tax data. We use corporate and individual income tax data from the Illinois Comptroller until the issue with the U.S. Census is resolved.
Additionally, the Census did not perform the State and Local Government Survey in 2001 and 2003 so data is unavailable for those years.
Despite these faults with the Census data, it is the best data source that exists to compare state and local government taxes to compare state and local government taxes throughout the country.
In 1997, the U.S. Bureau of Economic Analysis changed how gross domestic product and gross state product were calculated, resulting in a slightly higher value and causing a break in the historical chart above.